On January 8, 2019, a Vietnam-registered oil tanker Aulac Fortune has exploded and caught fire off the coast of Hong Kong’s Lamma Island, killing at least one person and leaving three missing.
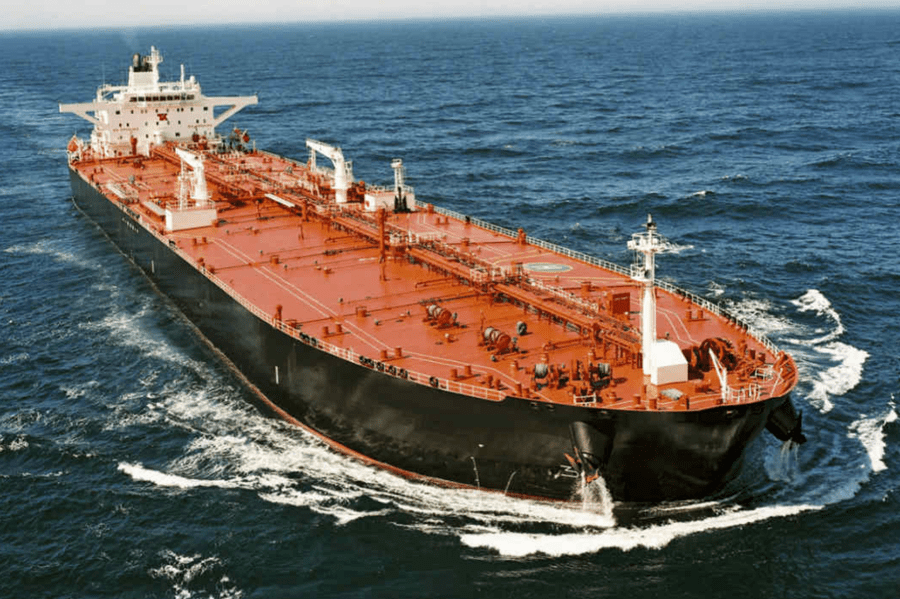
The largest oil tanker shipping companies in the world facilitate the majority of crude oil trade globally. They ship hundreds of billions of barrels of crude oil each year. An oil (or petroleum) tanker is a ship which is used for the transportation of oil across oceans. Oil tankers are of two types – crude tankers and product tankers. As the name suggests, crude tankers transport crude oil while product tankers (generally smaller in size) move refined oil products. While oil tankers have been around since the 1850s, supertankers came into vogue after the 1950s when the Suez Canal was temporarily closed and it was realized that larger tankers were more cost effective in transporting oil (particularly around Africa’s Cape of Good Hope).
Oil tankers come in a variety of sizes which is measured in deadweight metric tons (DWT). [Reminder: Deadweight means the difference between the displacement of a ship at the load waterline corresponding to the summer freeboard assigned for the water with a density of 1,025 t/m3 and the displacement of a light ship. In addition, a ship’s carrying capacity, including bunker oil, fresh water, ballast water, crew, and provisions is also factored in]. Crude tankers are among the largest, ranging from 55,000 DWT Pana-max-sized vessels to ULCC (ultra-large crude carriers) of over 440,000 DWT. The largest ULCCs can range in size up to half a million DWT and carry 3 million barrels at one go. Oil tankers are not only the only option to move oil apart from pipelines but also the cheapest option at just around 2 cents per gallon. It is estimated that around 2 billion barrels of crude oil were transported by oil tankers in 2018.
Tanker day rates indicate the dynamic between supply and demand for oil tankers which are determined by a number of factors. Besides transportation, oil tankers are also used as storage by oil traders who can gain from arbitrage between physical and future oil trades. The 10 largest oil tanker shipping companies in the world are a mix of both private and government owned companies.
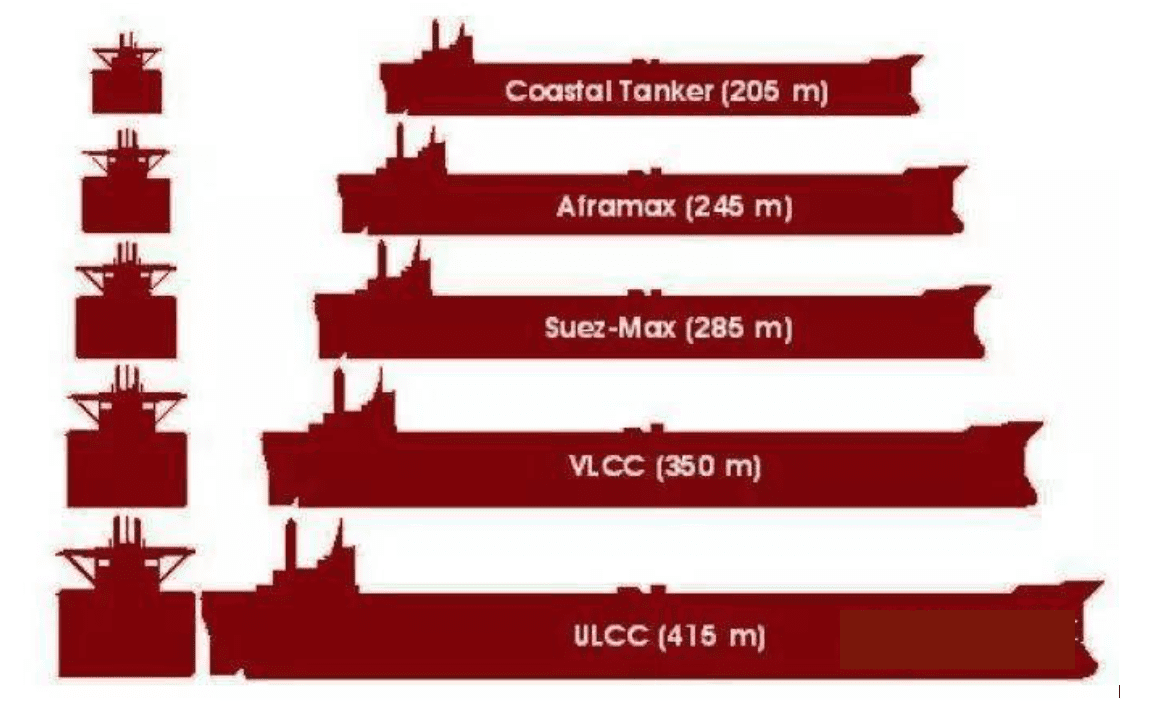
At the present time, the oil tankers most often used to transport crude oil, classified by types, based on their deadweights. The biggest oil tankers are the “supertankers” or VLCC and ULCC. Their capacity exceeds 200,000 DWT.

Crude Oil Tanker Size Categories
The smaller oil tankers to 80,000 DWT are used to transport petroleum products (the product tankers and Panamax class). The smallest work only near the coasts. The Aframax and Suezmax were classified supertankers in the past. Today they are way smaller than the biggest oil tanker.
In 1954, Shell Oil developed the average freight rate assessment (AFRA) system, which classifies tankers of different sizes. To make it an independent instrument, Shell consulted the LTBP (London Tanker Brokers’ Panel). At first, they divided the groups as General Purpose for tankers under 25,000 tons DWT; Medium Range for ships between 25,000 and 45,000 DWT and Large Range for the then-enormous ships that were larger than 45,000 DWT. The ships became larger during the 1970s, which prompted rescaling.
The system was developed for tax reasons as the tax authorities wanted evidence that the internal billing records were correct. Before the New York Mercantile Exchange started trading crude oil futures in 1983, it was difficult to determine the exact price of oil, which could change with every contract. Shell and BP, the first companies to use the system, abandoned the AFRA system in 1983, later followed by the other U.S. oil companies. However, the system is still used today. Besides that, there is the flexible market scale, which takes typical routes and lots of 500,000 barrels (79,000 m3).
Merchant oil tankers carry a wide range of hydrocarbon liquids ranging from crude oil to refined petroleum products. Their size is measured in deadweight metric tons DWT. Crude carriers are among the largest, ranging from 55,000 DWT Panamax-sized vessels to ULCCs of over 440,000 DWT.
Smaller tankers, ranging from well under 10,000 DWT to 80,000 DWT Panamax vessels, generally carry refined petroleum products, and are known as product tankers. The smallest tankers, with capacities under 10,000 DWT generally work near-coastal and inland waterways. Although they were in the past, ships of the smaller Aframax and Suezmax classes are no longer regarded as supertankers.
Apart from a short-lived increase towards the end of 2017, the global orderbook has continued to shrink. By April 2018, it had dropped 7 percent year-on-year to just under 77 million cgt (compensated gross tonne for double-hull oil tankers = 48 gross tonne 0.57) and just over 3,000 ships, the lowest level since 2004. The orderbook is split between 460 yards, 150 of them second-tier yards scheduled to deliver their last orders before the end of 2018. Japan’s orderbook experienced the biggest drop, declining 20 percent year-on-year, followed by South Korea which saw its orderbook decline by 9 percent. China managed to keep its orderbook constant, while Europe’s grew by 8 percent. The declining orderbook continues to put pressure on global order cover which has come down to 1.7 years from 1.9 years at the start of 2017. First-tier yards – those that have received new orders in the last 18 months – have average order cover of 1.8 years and second tier yards 1.3 years. South Korea and China have experienced a marginal improvement in their average order cover, due to a combination of higher contracting towards the end of 2017 and a decline in the countries’ active yard capacity. Japan’s order cover has continued its decline, which has lasted more than two years. Europe’s order cover has also experienced a slight decline, but it remains around three years, significantly above any of the other shipbuilding regions, due to the large increase in Cruise ordering (Chart 1).
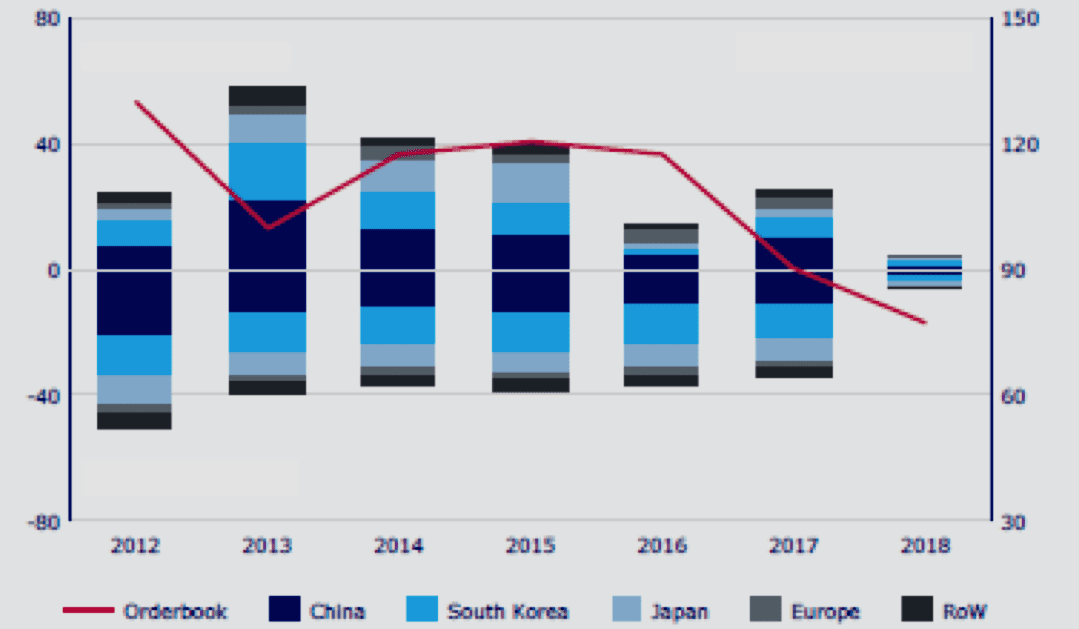
Source: Danish Ship Finance
Crude oil tankers come in various sizes, the biggest standard size being a Very Large Crude Carrier (or VLCC). These tankers take up to 2 million barrels of crude oil per shipment, while the second largest size is the ‘Suezmax’ which takes around half of that amount and is the largest size ship that can sail through the Suez Canal fully laden. The smallest size of dedicated crude oil tankers is an ‘Aframax’ which can carry around 600,000 barrels of oil. There are smaller tankers in the market, but these tend to carry refined oil products and fuel oil, not crude oil. Euronav depreciates the original cost of a vessel to zero value over 20 years.
Construction of crude oil tankers takes 9 to 15 months from the time the keel is first laid. This means that it will take at least two years from the time of newbuilding contract signature (ordering) until the vessel is delivered because many critical parts are long-lead items that needs to be ordered and produced before the construction of the ship can commence. Their sheer size dictates that there is a limited number of sites capable of building them and these are concentrated in Asia, more specifically in South Korea, China and Japan.
Size of World Fleet
Although it is practically impossible to find out an exact figure of the current global fleet of oil tankers, we have indirectly concluded that at the end of 2018 there were almost 15,100 tankers world-wide (against 12,975 oil vessels at February 1, 2014, and 14,512 oil ships as of the start of 2017) with combined nearly 661 mln tonnes of deadweight tonnage (as compared to 636.4 mln dwt as of January 1, 2017) and ships’ value, according to the UNCTAD, of U.S. $130.7.
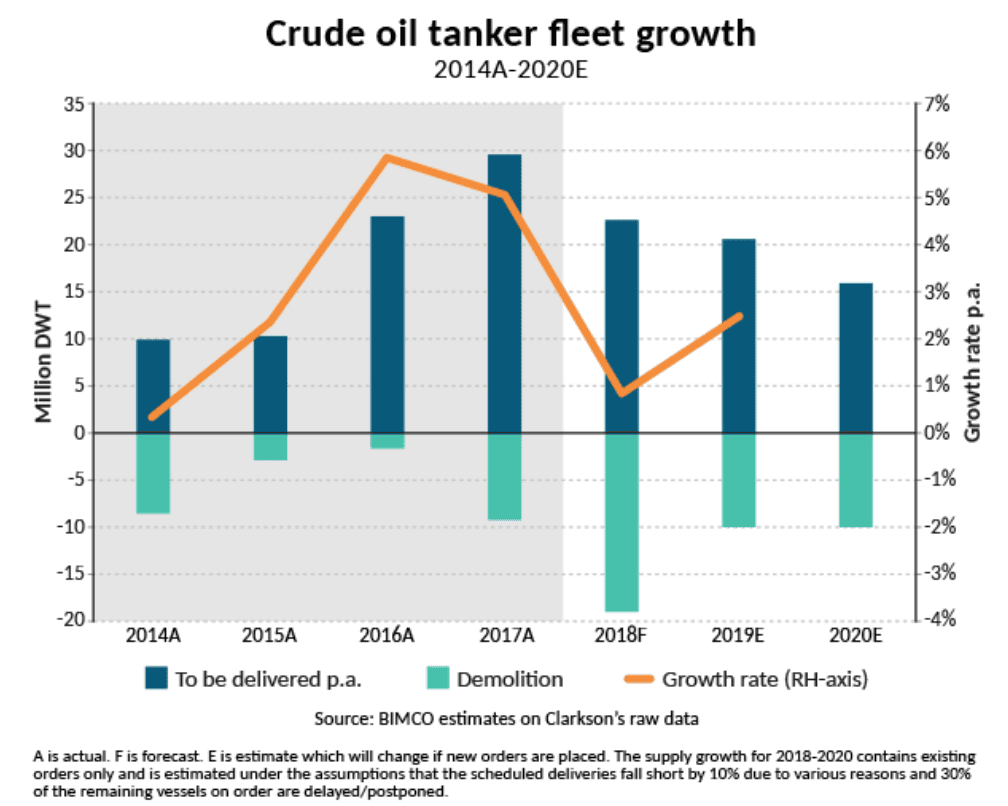
The total crude oil tanker fleet has grown only slightly in 2018. The VLCC and Aframax fleets specifically haven’t been growing over the past 12 months. The freight market is severally impacted by very weak demand growth. “Overall, the freight market is oversupplied. The key to higher earnings lies within a very low fleet growth and a return to normalized demand level. The sooner the better – but patience is required,” Sand explained. “2018 is set to become another loss-making year for the cru-de oil tanker industry as the industry will most likely have to wait until the second half of 2019 before an improved market balance will yet again deliver profits.”
The result is that the world tanker fleet continues to age at an accelerating rate. In 1993, only 12 percent of that fleet was more than 20 years old. The most recent figures available show this has now grown to more than 35 percent, with nearly 45 percent of all VLCCs now 20 years of age or older.
Somerville’s concern stems from a review of the current order books at all the major shipyards worldwide, particularly those capable of building large tankers. “The mean estimated backlog at the primary tanker new-building yards is 36 months,” he said. “That means we know how much new tanker tonnage will be delivered during that period, and we know that it will not be sufficient to reverse the aging of the fleet.”
In 2018, according to the London-based Clarksons, the world’s biggest shipbroker, owners of tankers has written off 100 oil ships, including 46 Aframaxes, 34 VLCCs and 20 Suezmaxes. This was a kind of historical record, including 1985 (when 90 tankers were demolished). Thomson Reuters Re-search (TRR), which included coastal tankers, gives even higher figures for 2018 (Chart 3).
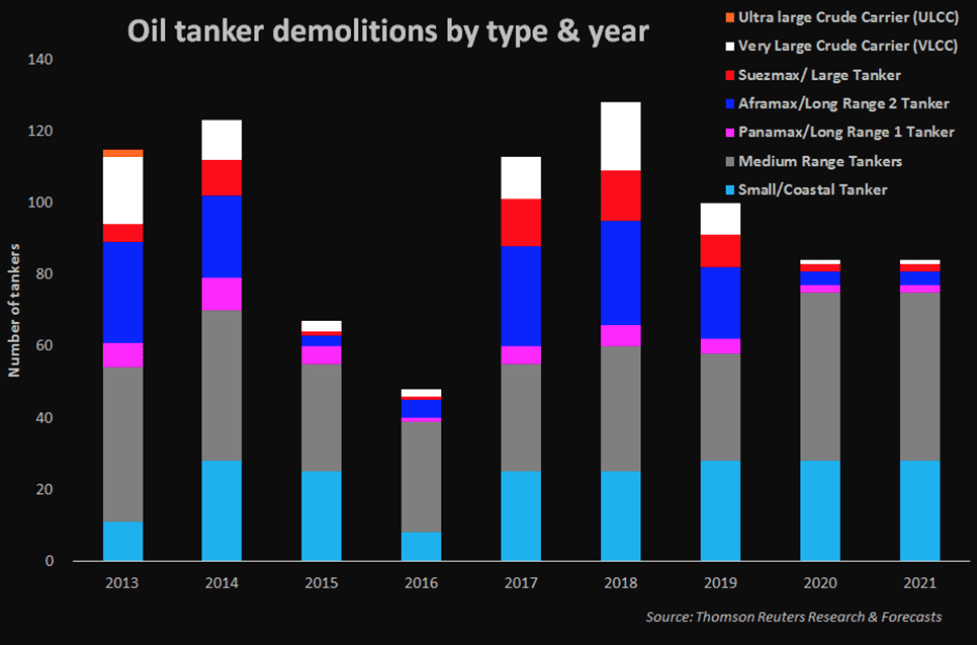
Curtailment of OPEC cargoes and environmental regulations, that are proving uneconomical to comply with, have got the owners purging the supertanker fleet at the fastest pace since the 1980s, according to Global Marketing Systems Inc., one of the world’s top buyers of obsolete ships for scrap.
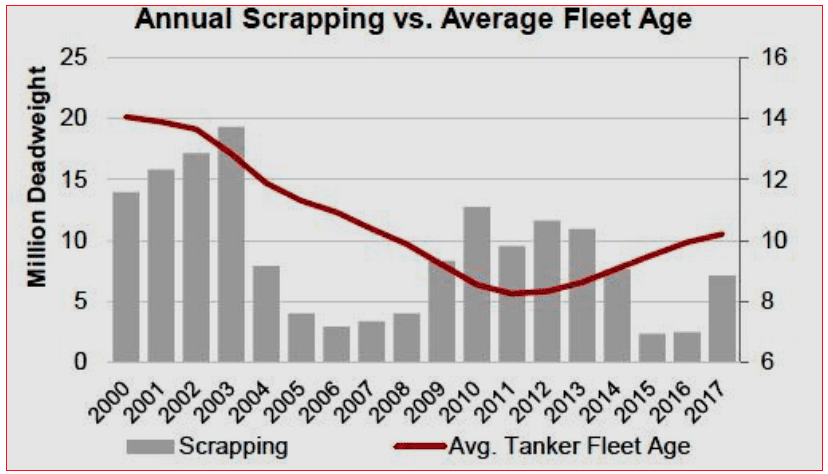
While the demolition surge – sending vessels to be ripped apart on the beaches of India and Bangla-desh – reflects the worst charter rates for owners in decades, scrapping often helps set the stage for market recoveries. Morgan Stanley estimates that the global fleet of so-called very large crude carriers could lack 100 million barrels of transportation capacity by late 2020. “It prolongs the period of pro-fitability after the turnaround,” said Fotis Giannakoulis, a New York-based shipping analyst at the bank. “The more you scrap, the more you bring the recovery forward and accelerate its speed. The market will strengthen with high scrapping even with smallest growth in demand.” You can clearly see on the graphic (Chart 4), the tanker demolition process is mainly economic.
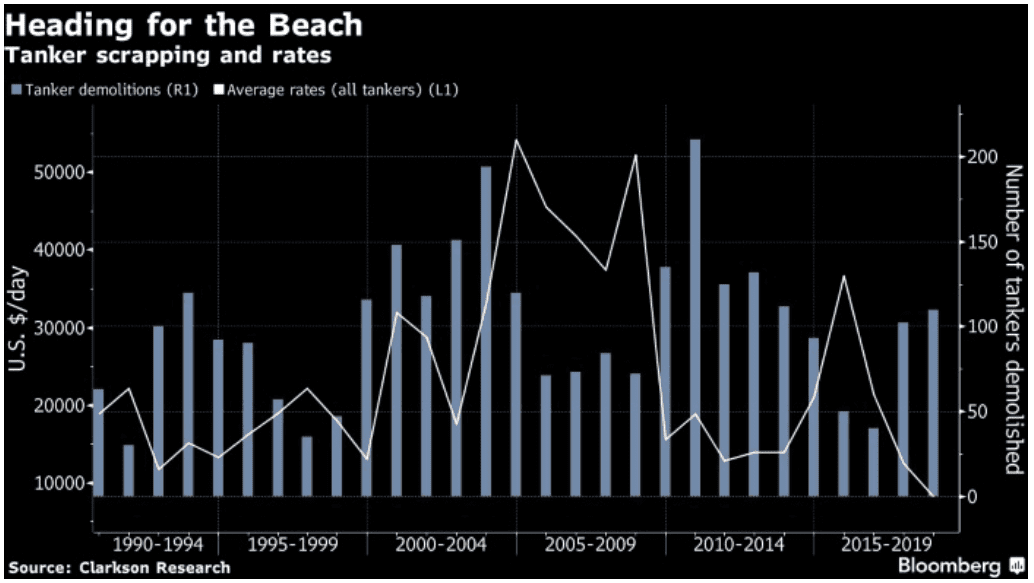
Source: Bunker Ports News Worldwide
Average earnings for 2 million barrel-hauling VLCCs fell by 65 percent to $6,159 a day until August 2018, the lowest since at least 2009, according to data from Clarkson Research Services, Ltd. They were $17,794 a day for all of 2017, $41,488 for 2016 and $64,846 in 2015. Owners have been hurt by a pact among members of the Organization of the Petroleum Exporting Countries, and allies led by Russia, to restrict crude output by 1.8 million barrels a day since the start of 2017. About 20 million barrels, or 10 cargoes, get loaded every day onto very large crude carriers, or VLCCs, according to Clarksons.
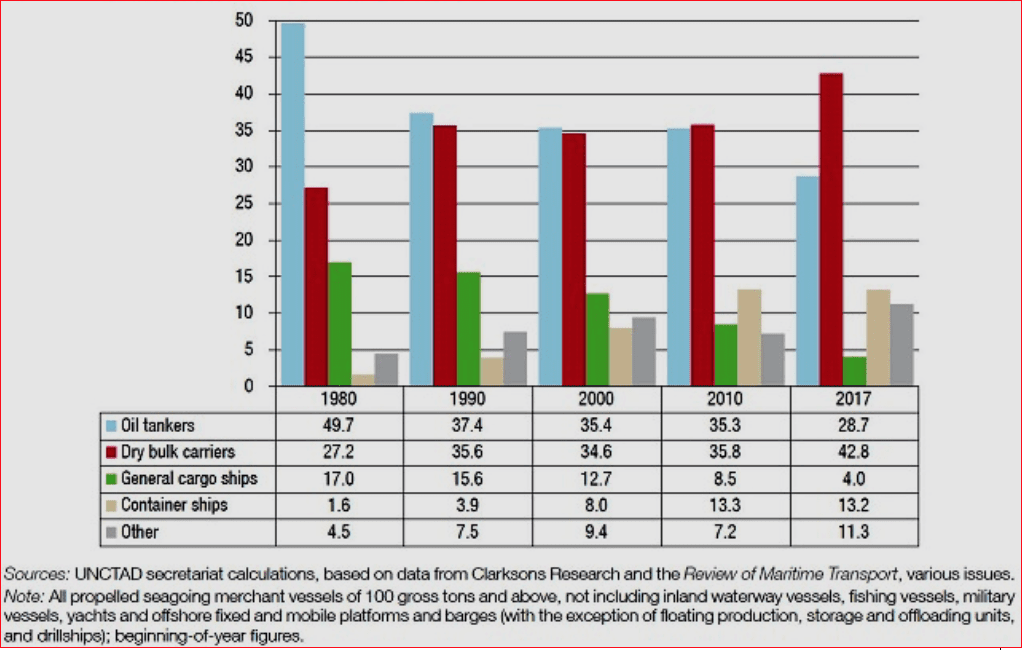
Before the beginning of this millennium oil tankers dominated the global marine fleet by tonnage but by today their world share – second to dry bulk carriers – decreased to less than 30 percent (Chart 5).
Source: The Maritime Executive
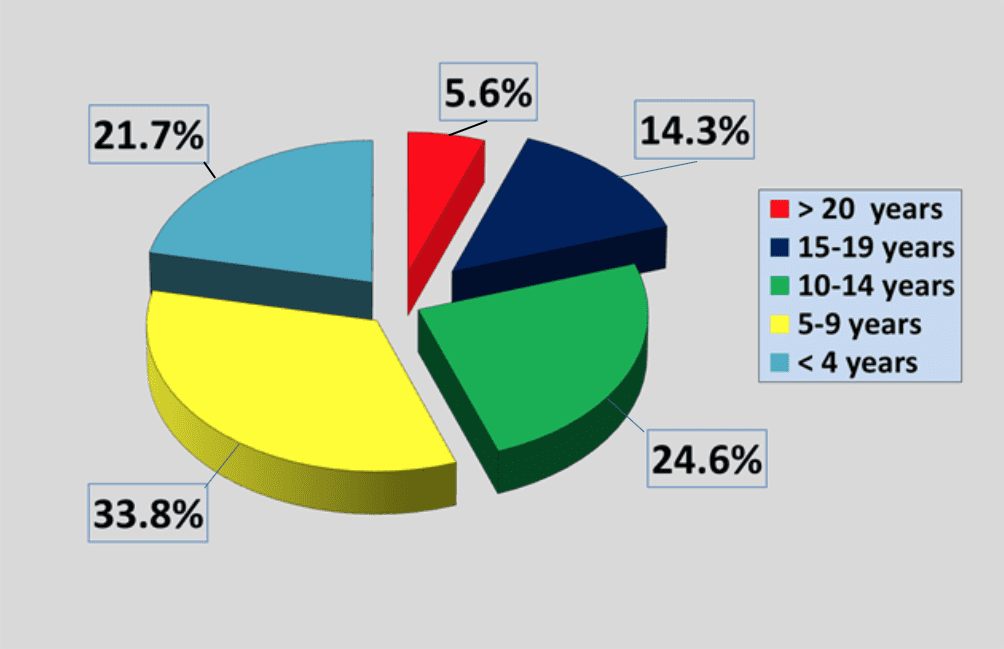
At present, global tanker fleet is quite young – on the average, around 11 years old – inferior only to dry bulk carriers and container ships, with over one-fifth of existing tankers worldwide being younger than four years (Charts 6 and 7).
Source: Drawn by the author based on data from the United Nations Conference on Trade and Development
Source: Teekay
Largest Tankers
Until 1956, tankers were designed to be able to navigate the Suez Canal. This size restriction became much less of a priority after the closing of the canal during the Suez Crisis of 1956. Forced to move oil around the Cape of Good Hope, shipowners realized that bigger tankers were the key to more efficient transport. While a typical T2 tanker of the World War II era was 532 feet (162 m) long and had a capacity of 16,500 DWT, the ultra-large crude carriers (ULCC) built in the 1970s were over 1,300 feet (400 m) long and had a capacity of 500,000 DWT. Several factors encouraged this growth. Hostilities in the Middle East which interrupted traffic through the Suez Canal contributed, as did nationalization of Middle East oil refineries. Fierce competition among shipowners also played a part. But apart from these considerations is a simple economic advantage: the larger an oil tanker is, the more cheaply it can move crude oil, and the better it can help meet growing demands for oil.
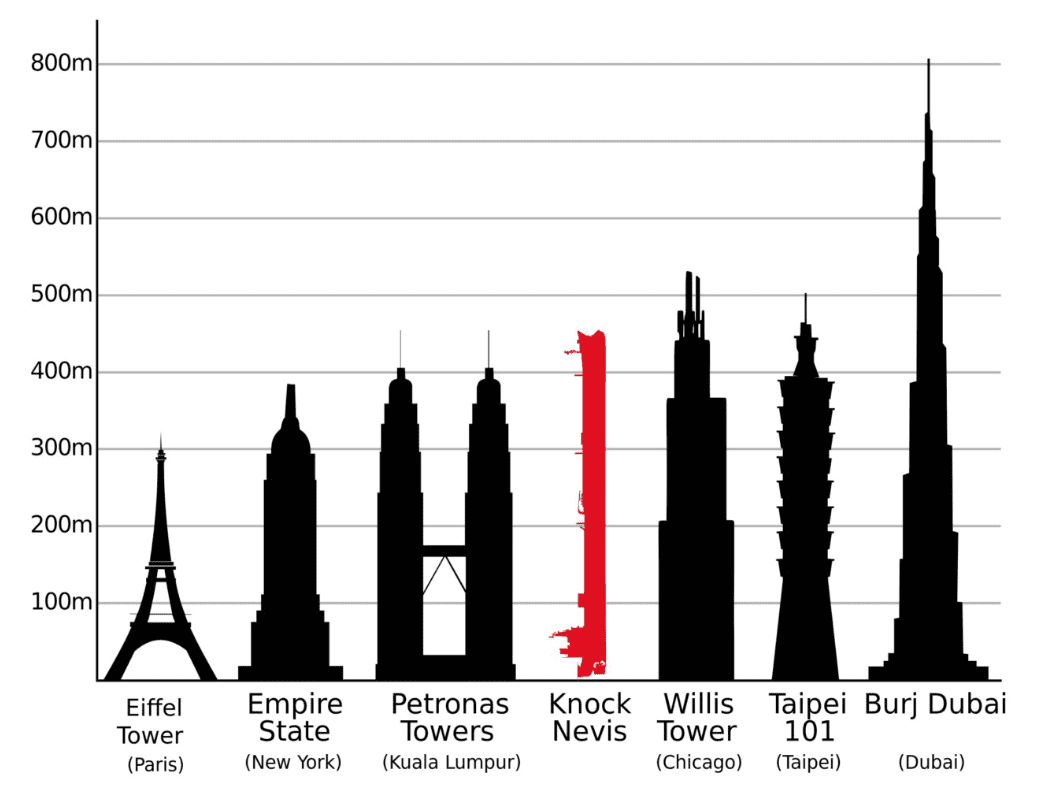
In 1955 the world’s largest supertanker was 30,708 GRT and 47,500 LT DWT: SS Spyros Niarchos launched that year by Vickers Armstrongs Shipbuilders, Ltd in England for Stavros Niarchos. In 1958 United States shipping magnate Daniel K. Ludwig broke the record of 100,000 long tons of heavy displacement. His Universe Apollo displaced 104,500 long tons, a 23 percent increase from the previous record-holder, Universe Leader, which also belonged to Ludwig. Knock Nevis, ex Seawise Giant, rivaled some of the world’s largest buildings in size.
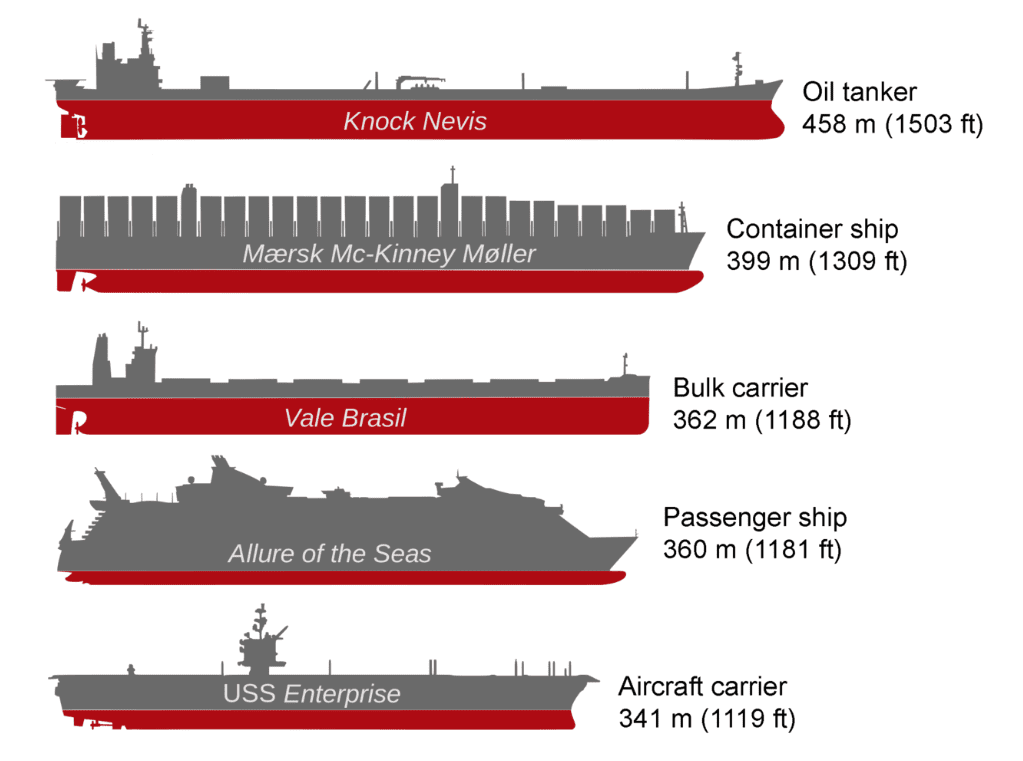
The world’s largest supertanker was built in 1979 at the Oppama shipyard by Sumitomo Heavy Industries, Ltd., named Seawise Giant. This ship was built with a capacity of 564,763 DWT, a length overall of 458.45 meters (1,504.1 ft) and a draft of 24.611 meters (80.7ft). She had 46 tanks, 31,541 square meters (339,500 sq ft) of deck, and at her full load draft, could not navigate the English Channel. Seawise Giant was renamed Happy Giant in 1989, Jahre Viking in 1991. Shortly after that she was bought by Jørgen Jahre and renamed as Jahre Viking. First Olsen Tankers Pte., Ltd. purchased her in 2004 and she was renamed to Knock Nevis as she was converted into a permanently moored storage tanker at Qatar’s Ash-Shaheen oil field in the Persian Gulf. Her new owners, Amber Development Corporation, renamed her as Mont for her final voyage to Alang, Gujarat, India in 2010 where she was scrapped.
The biggest oil tankers in service currently are the TI Class. TI Europe and her sister ships TI Africa, TI Oceania and TI Asia were the first ULCC built for the last 24 years.
These ships were built in 2002 and 2003 as Hellespont Alhambra and Hellespont Tara for the Greek Hellespont Steamship Corporation. Hellespont sold these ships to Overseas Shipholding Group and Euro-nav in 2004. Each of the sister ships has a capacity of over 441,500 DWT, a length overall of 380.0 meters (1,246.7 ft) and a cargo capacity of 3,166,353 barrels (503,409,900 l). They were the first ULCCs to be double-hulled. To differentiate them from smaller ULCCs, these ships are sometimes given the V-Plus size designation.
In 2017, in China’s Qingdao, there was built and floated the world’s biggest ore-carrier tanker, which is regarded the largest (after Knock Nevis) marine vessel and was immediately called “marine giant.” The height of the vessel (30.4 m or almost 100 ft) is that of a typical 10-story building. The length of it is 362 m (1188 ft), the water displacement – 400.000 tonnes and its maximum speed – 14.5 knots. The Chinese plan to build some 30 such ships in the future.
Ownership
At present, the first 10 of the world’s biggest tanker owners (first of all, Greece and China) possess some 121.8 mln tons of deadweight tonnage or over 19.1 percent of global tanker fleet Thus, accor-ding to IHS Markit, almost 30 percent of tankers on order (by tonnage) as of the start of 2018 was owned by Greece.
Also, tanker fleet owned by the OPEC countries (191 tanker ship with aggregate tonnage of over 30 mln dwt at the start of 2017 against 184 tankers with shipping capacity of 26.6 mln dwt at the beginning of 2013) is quite impressive (Table 1 and Chart 8). That, according to OPEC Secretariat, accounted for nearly 6.6 percent of global oil tanker deadweight tonnage in 2014.
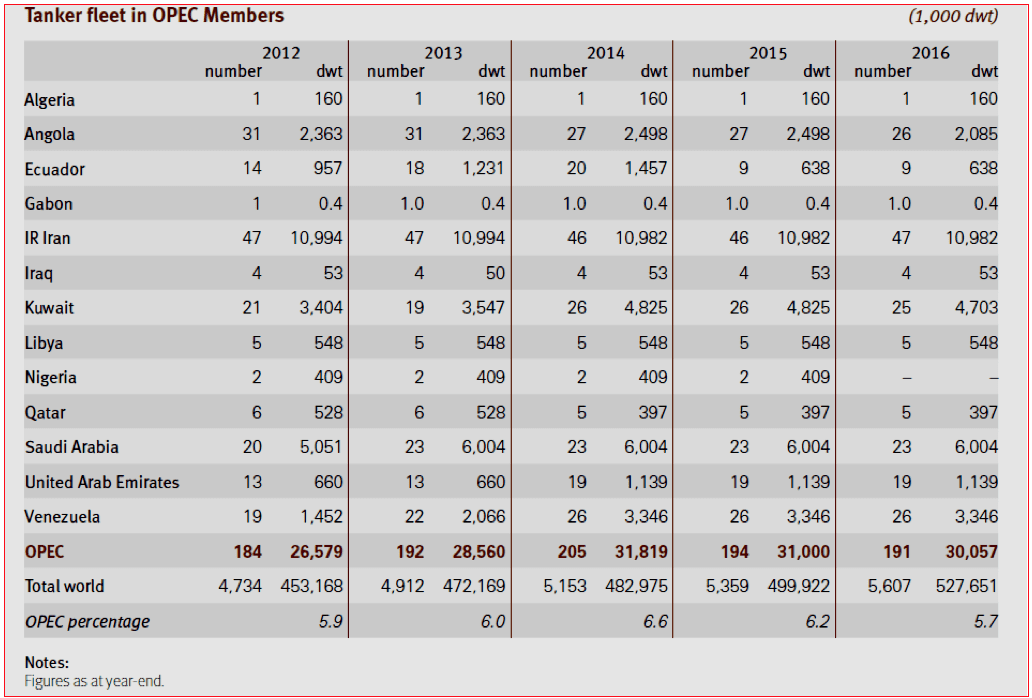
Source: Annual Statistical Bulletin 2017 – Vienna: OPEC, 2017, p. 80
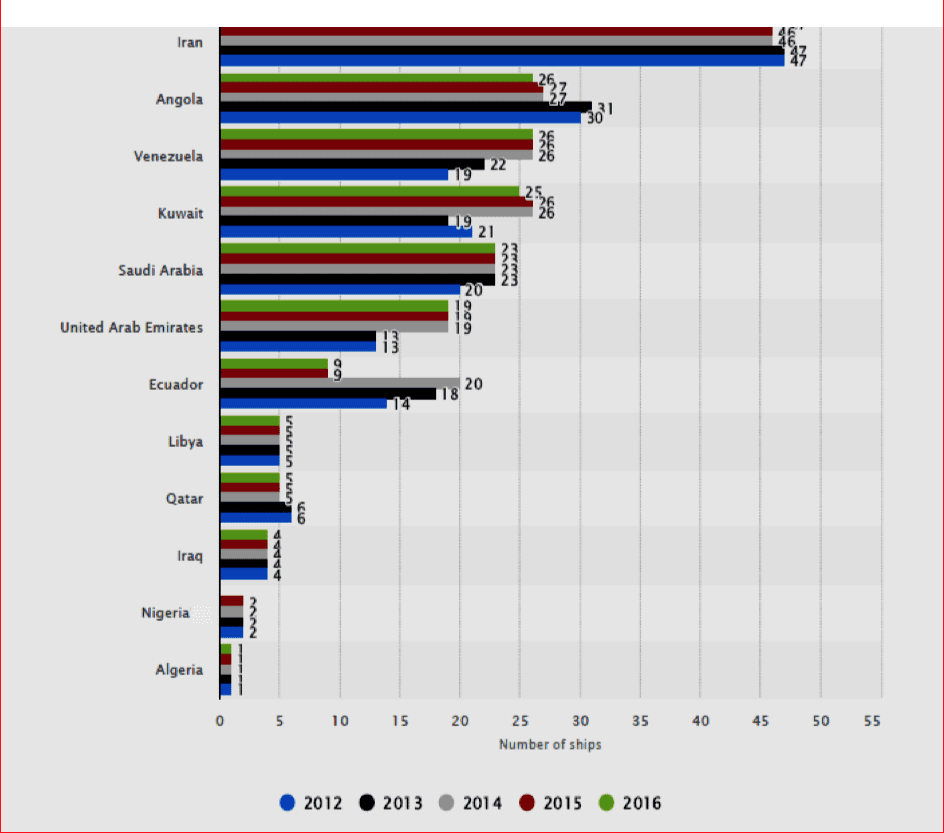
Source: Statista
Everyone talks about Chinese demand for oil. But the Chinese are also increasing their demand for the ships that move that oil around. Chinese companies currently own about 70 very large crude carriers out of a total global VLCC fleet of 633 units, or about 11 percent of the world’s working supertankers. In addition, Chinese firms currently have about 27 new tankers on order at shipyards, or about one-third of the current global orderbook. But that is not nearly enough for Beijing. In June, China Shipping Tanker Co. announced plans to build up to four new VLCCs and at the start of this year privately owned Shandong-based Landbridge Group ordered three new VLCCs, due to be ready by 2016.
State-owned Sinopec has said that China’s four state owned tanker companies shipped 47 percent of the crude imported to China last year, while recent estimates suggest 50-60 percent of the country’s oil imports now arrive on Chinese tonnage. However, while growing fast, this still compares unfavorably with Japan, which moves almost 90 percent of its 3 million b/d-plus crude imports on domestically-owned tankers. Until more ships are built or bought by Chinese firms, the remainder of China’s oil imports still has to be carried on foreign ships chartered on the open market.
An April report by Poten & Partners calculated that China’s spot tanker demand accounted for the equivalent of the full utilization of 150 very large crude carriers in 2013, or 23 percent of the world’s fleet of VLCCs, up from 66 in 2009. State oil company Sinopec’s trading arm Unipec is reportedly the world’s biggest spot charterer of VLCCs. For now, Unipec and other Chinese state-owned oil company charterers, several of which have Western-sounding names such as Blue Light (Sinochem) or Glasford (PetroChina), still have to charter ships on the spot market. But the Chinese government wants that to become less and less necessary as the domestic supertanker fleet grows, according to Ralph Leszczyn-ski, Singapore-based head of research at Italian shipbroker Bancosta. “There is the clear intention for the majority of Chinese oil imports in the future to be carried by Chinese-owned ships,” he says. And Beijing dislikes spot market volatility. For example, VLCC rates on the Persian Gulf to China route were over $11.40/mt on August 13, 2018, up from just under $10/mt, a week earlier. The August 12, 2018 announcement of a new $1.1 billion oil shipping venture between China Merchants Energy Shipping and Sinotrans & CSC gave some indication of the scale of these companies’ existing holdings and their future ambitions.
China Merchants Energy said the new JV aims to establish one of the world’s leading tanker fleets and will use purchases of secondhand ships, plus newbuilds to build an oil tanker fleet of “international scale,” thus boosting the JV’s competitiveness in the international market. By some estimates the new joint venture will be among the world’s top three VLCC operators. China Merchants will hold 51 percent of the joint venture and will put its nine existing VLCCs, plus 10 VLCCs currently on order, into the new company. The deal excludes its seven Aframax tankers and its growing LNG fleet. Sinotrans & CSC is primarily a dry bulk and container shipping company and will not contribute the 19 VLCCs owned by its subsidiary Nanjing Tanker. Those vessels are mostly mortgaged to banks or collateralized for outstanding loans. In April the firm delisted from the Shanghai stock exchange after posting losses for four straight years, making it the first Chinese state-controlled company to be delisted from the bourse. Nanjing Tanker’s woes could explain the rationale for the JV, as Beijing tries to stem state shipowners’ mounting losses by forcing more consolidation in the sector. With oil trade slowing down in the developed world, China and India will account for the bulk of oil trade growth.
Given China’s investments in VLCCs it is not a difficult to see who the losers in this race will be. “This is certainly bad news for established independent owners such as the Japanese (MOL, NYK) and Greeks (such as Anagel) as they will be left fighting for the spoils of the shrinking OECD-countries import volumes. And this in the context when the tanker shipping market is already suffering from heavy overcapacity and very low returns for shipowners,” reasons Bancosta’s Leszczynski. The one caveat to his prediction on impending dominance of its VLCC market, Leszczynski said, was that China’s oil industry may open up in similar ways as it has with its coal, power sector or steel industry that are “less regulated and more open to private and international competition (also on the shipping side).”
As for the largest companies owning oil tankers, until the 1970s the world’s largest owners of oil tankers were the so-called Seven Sisters, including Exxon, RDS, British Petroleum and other “big-oil” companies. But oil giants started to sell out their tanker fleet and now the largest oil tanker owners are specialized shipping companies, including first of all Teekay, MOL Tankship Management, NITC (National Iranian Tanker Co.), National Shipping Company of Saudi Arabia, Bermudas-headquatered Frontline, Florida-based Overseas Shipholding Group, and Belgium’s Euronav.
The biggest out of them surely is Teekay Group, which is the world’s largest transporter of hydrocarbons and since 1974 is based in Hamilton (Bermudas). The tanker fleet of this conglomerate is now consisted of 123 vessels of various sizes and has total tonnage of 16 mln dwt. The group includes the following public companies: Teekay Corp., Teekay LNG Partners, Teekay Offshore Partners, Teekay Tankers and Teekay Tanker Investments.
The second by a size of deadweight is Japan’s MOL (Mitsui O.S.K. Lines), which was founded in Tokyo as early as in 1884. Originally the shipping company was called OSK Lines. However, in 1964 it merged with Mitsui Steamship and MOL has appeared which now owns 11.3 mln dwt of oil tankers in addition to 3.6 mln dwt chartered by the company. As of the start of 2017, the Japanese giant possessed and managed 163 tankers of various classes.
Registration
To avoid unnecessary state formalities and taxes most oil tankers are registered under a flag that differs from the flag of the country of ownership (or, by other words, under a flag of convenience, FOC).
The term “flag of convenience” has been used since the 1950s. A registry which does not have a nationality or residency requirement for ship registration is often described as an open registry. Panama, for example, offers the advantages of easier registration (often online) and the ability to employ cheaper foreign labor. Furthermore, the foreign owners here pay no income taxes.
Open registries have been criticized, mainly by trade union organizations based in developed countries, especially those of Europe. One criticism is that shipowners who want to hide their ownership may select a flag-of-convenience jurisdiction which enables them to be legally anonymous. Shipowners may select a jurisdiction with measurement rules that reduce the certified GRT size of a tanker, so as to reduce subsequent port of call dock dues.
The three leading flags of registration are those of countries that are not major shipowners, namely Panama, the Marshall Islands and Liberia. The Marshall Islands has continued to increase its market share in recent years and, as at January 2018, had become the world’s second largest FOC registry. The fourth and fifth largest registries are Hong Kong (China) and Singapore, which accommodate both owners headquartered in each economy and owners from other economies. With regard to commercial value, almost 24 percent of the world’s dry bulk carrier fleet is registered in Panama; 17 percent of the oil and gas tanker fleet – in the Marshall Islands, including many Greece-owned tankers; 27 percent of the ferry and passenger ship fleet – in the Bahamas, and 16 percent of the container ship fleet – in Liberia, including many Germany-owned vessels.
The United States Central Intelligence Agency’s global statistics count 4,295 oil tankers of 1,000 deadweight tonnes or greater. Panama is the world’s largest flag state for oil tankers, with 528 of the vessels in its registry. Some other flag states has more than 200 registered oil tankers: Liberia (464), Singapore (355), China (252), the Marshall Islands (234) and the Bahamas (209). By way of comparison, the United States and the United Kingdom have only 59 and 27 registered oil tankers, respectively.
Flag-of-convenience tankers have been involved with some of the highest-profile oil spills in history (such as oil spills from the Maltese-flagged MV Erika, the Bahamian-flagged MV Prestige, the Liberian-flagged SS Torrey Canyon, MV Amoco Cadiz and MV Sea Empress) (Charts 11 and 12).
According to the UNCTAD, as of 1/1/2018, the following value of oil tankers of 1,000 dwt and above was registered (in U.S.$ mln; in brackets – in percent of the total value): in Panama – 12,564 (9.6); Marshall Islands – 22,479 (17.2); Bahamas – 7,430 (5.7); Liberia – 15,284 (11.7); Hong Kong – 9,370 (7.2); Singapore – 10,764 (8.2); Malta – 8, 769 (6.7); China (w/o Hong Kong) – 4,900 (3.8); Italy – 1,400 (1.1); Greece – 8,832 (6.8); the United Kingdom – 562 (0.4); Bermudas – 413 (0.3); Japan – 2,417 (1.8); Cyprus – 721 (0.6); Norway – 1, 672 (1.3); Isle of Man – 2,646 (2.0); and in the United States – 1,311 (1.0).
Economics
At present, time charter rates for an oil tanker varies from US$13,000-13,200 for a handysize vessel to US$32,500-33,000 (Chart 9).
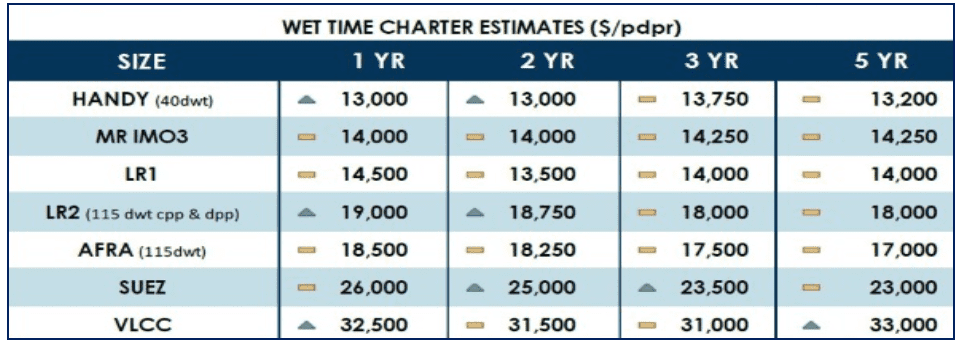
Source: Hellenic Shipping News Worldwide
With the exception of the pipeline, the tanker is the most cost-effective way to move oil today. Worldwide, tankers carry some 2 billion barrels (3.2×10¹¹ l) annually, and the cost of transportation by tanker amounts to only US$0.02 per gallon at the pump. Second only to pipelines in terms of efficiency, the average cost of oil transport by tanker amounts to only two or three United States cents per 1 US gallon (3.785 l).
BIMCO (Baltic and International Maritime Council) has called 2018 “absolutely horrible” for crude oil tankers. Almost all large tanker companies in the world reported loss results in the first half of 2018. For example, consolidated net loss of Teekay totaled about $48 million, Euronav – $51.6 mln, Torm – $7.5 mln, Team Tankers – $2.9 mln, DHT Holdings – $37.4 mln, International Seaways – $48.11 mln, Hafnia Tankers – $12.03 mln, and Russia’s Sovcomflot – $57.8 mln. Earnings for LVCCs in the first half of 2018 were as low as US$ 6,001 per day on average, with a Suezmax tanker earning US$ 10,908 per day and an Aframax making US$ 9,614 per day. Most of 2017 was actually similar (Chart 10).
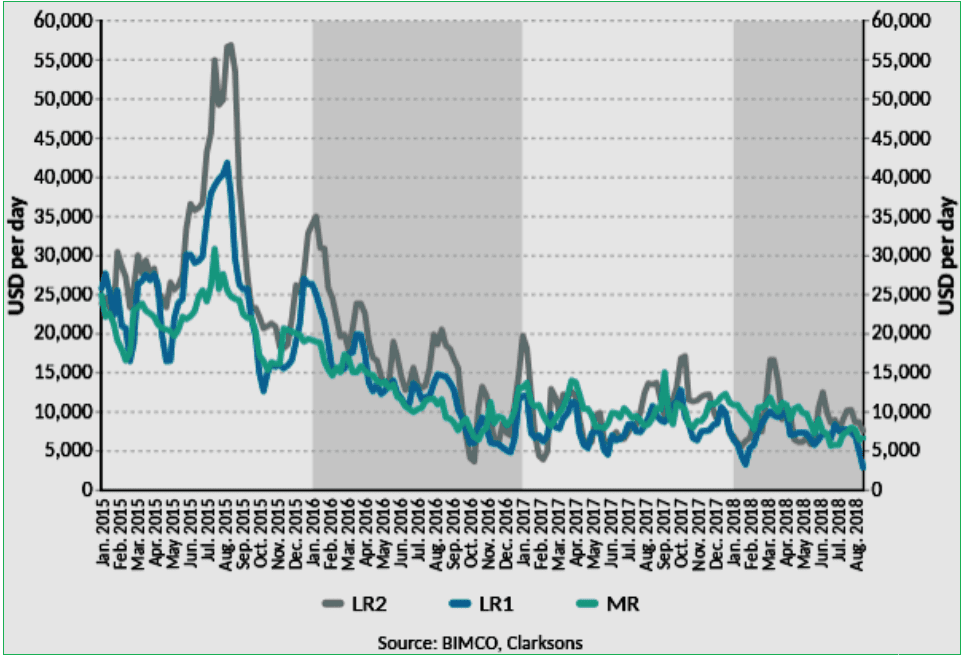
Source: BIMCO
The average newbuilding price has continued its upward trend and has risen 5 percent since April 2017. The largest price increase has occurred in the Bulk segment, followed by the Container and Tanker segments. Gas Carrier prices have continued to decline. The higher prices have been driven by stronger demand, fewer yards attracting orders and a significant increase in raw material prices, which has challenged yard profitability.
The price for contracting a tanker newbuilding is influenced by a number of factors such as the underlying price of energy, steel, labor costs and available construction finance. The relative demand for contracting new tonnage also plays a role and may lengthen or shorten waiting time to delivery and affect price. Over the last ten years the cost of a new VLCC has ranged from around US$80 million to US$160 million. The payment profile on the ships tends to be very back loaded, typically with a 10 percent deposit on signing the contract, 20 to 40 percent in milestone payments and finally 50 to 70 percent on delivery. The economic lifespan of an oil tanker has historically been 25 years, although more recently this has dropped closer to 20 years. Different tanker companies operate with their own asset depreciation policies, ranging from 18 to 25 years. Euronav depreciates the original cost of a vessel to zero value over 20 years.
A shipowner chartering his vessel to a customer is paid ‘freight’; this is the gross revenue agreed with the charterer to cover the entire voyage from port of loading to port of discharge. This revenue is used to cover the cost for the owner to undertake the voyage, the cost of operating the vessel, any interest payments to loan providers and other costs associated with owning a ship. Certain fixed costs vary between shipping companies, most important the purchase price, and each will therefore have their individual breakeven cost at which it becomes profitable to run the vessels. However, once these fixed costs are covered, all additional revenue results in profit. Earnings are reported by companies and market watchers in terms of ‘dollars per day’ also known as the Time Charter Equivalent (TCE). The cash breakeven TCE for a VLCC is between US$20,000 per day to US$35,000 per day depending on the level of loan interest, fixed operating costs and depreciation (or amortization) and G&A expenses (Chart 11).
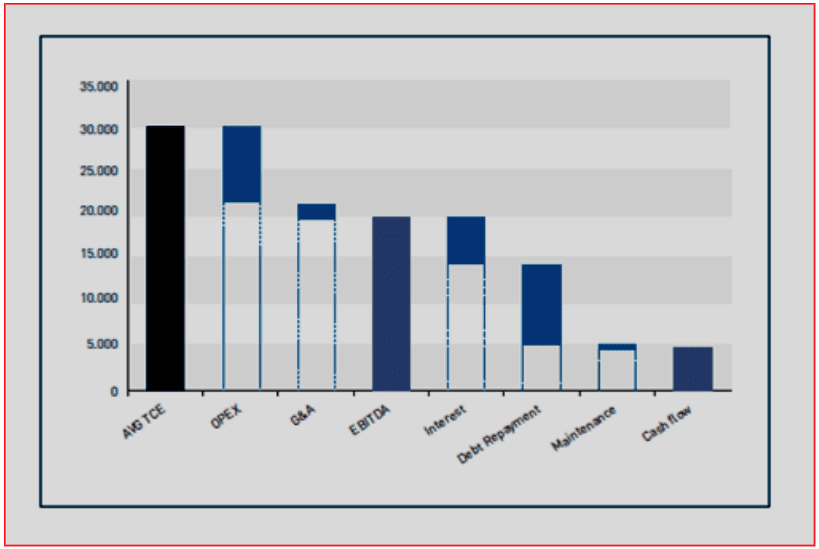
Source: Euronav
The price of a newly built oil tanker varies greatly depending first of all on its class. Thus, average price of a new VLCC is now around US$97 mln, of a Suezmax oil ship – U.S. $65 mln, and of an Aframax oil tanker – U.S. $55 mln.
Pollution
For close to five decades, the frequency of oil spills from tankers has shown a progressive downward trend. The average number of spills of 7 tonnes or more is now about six per year, from a high of 79 in the 1970s. The yearly average for large spills, i.e., greater than 700 tonnes, has also reduced from around 25 in the 1970s to less than two since 2010 (Charts 12 and 13).
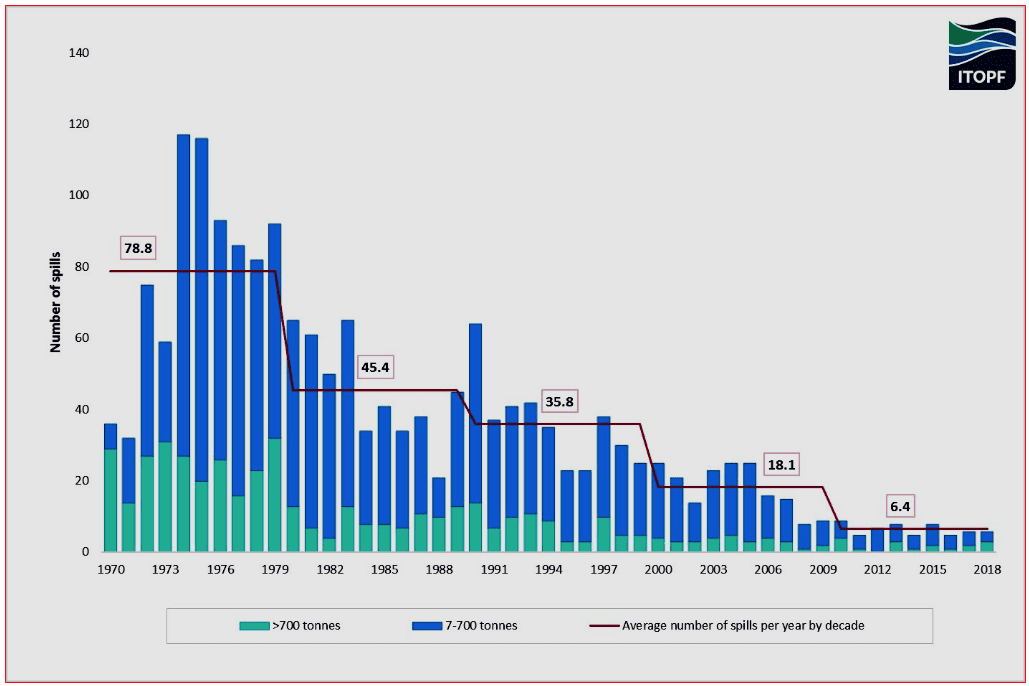
Source: ITOPF
A decline can also be observed with medium sized spills (7-700 tonnes). Here, the average number of spills per year in the 1990s was 28.1, reducing to 14.9 in the 2000s and is currently 4.7 for the 2010s (not a complete decade).
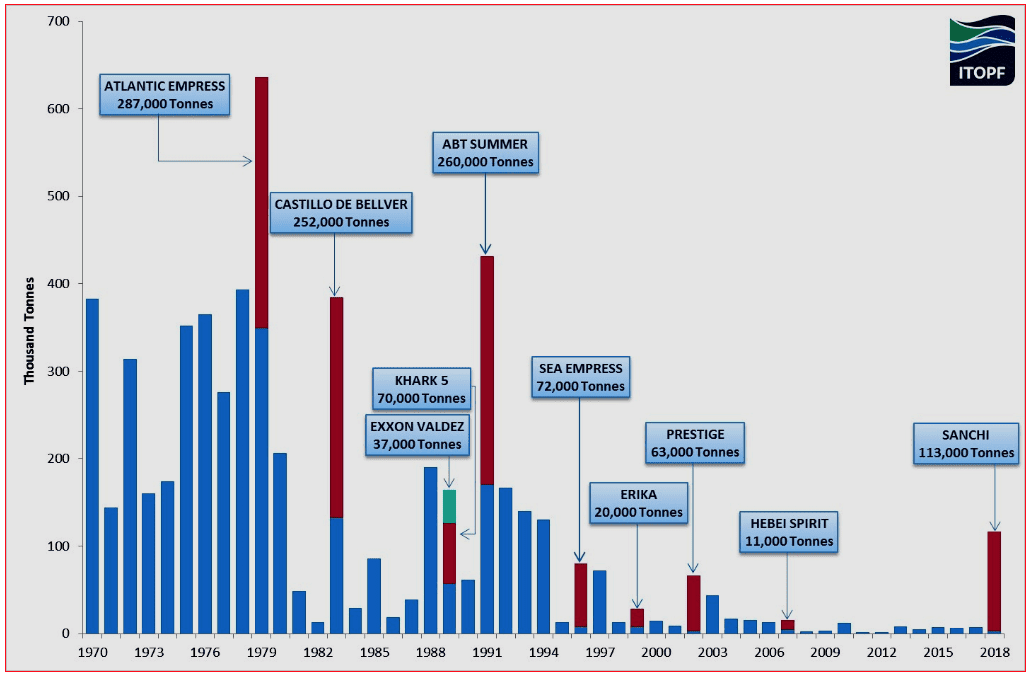
Source: ITOPF
When looking at the frequency and quantities of oil spilt, it should be noted that a few very large spills are responsible for a high percentage of the oil spilt. For example, in more recent decades the following can be seen:
- In the 1990s there were 358 spills of 7 tonnes and over, resulting in 1,134,000 tonnes of oil lost; 73 percent of this amount was spilt in just 10 incidents.
- In the 2000s there were 181 spills of 7 tonnes and over, resulting in 196,000 tonnes of oil lost; 75 percent of this amount was spilt in just 10 incidents.
- In the nine-year period 2010-2018 there have been 59 spills of 7 tonnes and over, resulting in 163,000 tonnes of oil lost; 92 percent of this amount was spilt in just 10 incidents. One incident is responsible for about 70 percent of the quantity of oil spilt this decade.
In terms of the volume of oil spilt the figures for a particular year may be severely distorted by a single large incident. This is clearly illustrated by incidents such as Atlantic Empress (1979), 287,000 tonnes spilt; Castillo de Bellver (1983), 252,000 tonnes spilt; ABT Summer (1991), 260,000 tonnes spilt; and Sanchi (2018), 113,000 tonnes spilt.
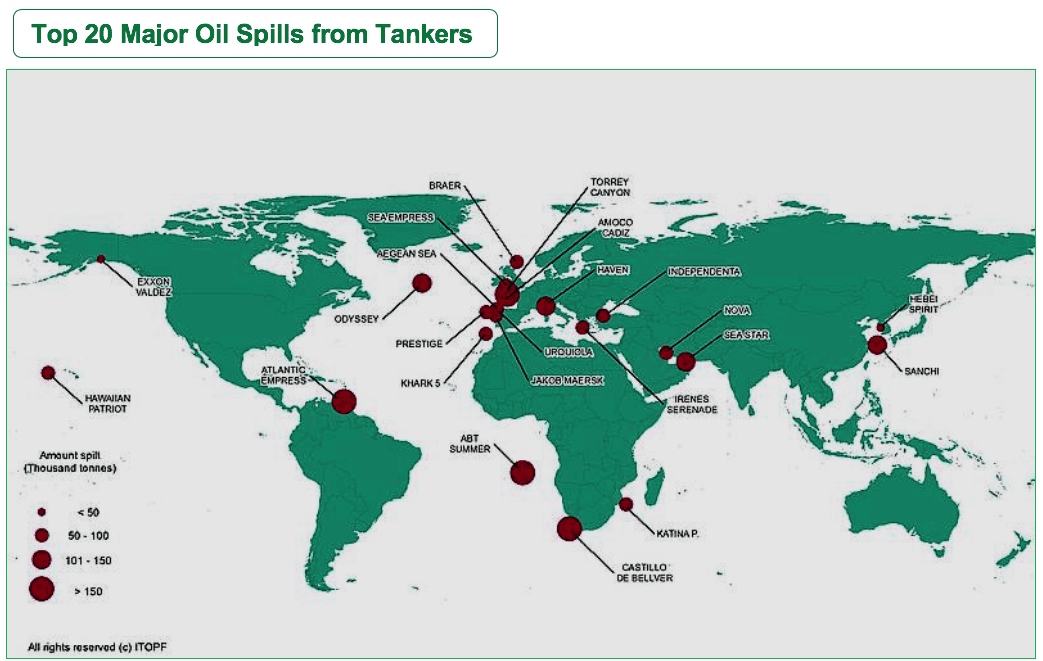
A summary of the top 20 major spills that have occurred since the Torrey Canyon in 1967 is given below. It is of note that 19 of the 20 largest spills recorded occurred before the year 2000. Sanchi, the latest addition to the list, is the only major spill of non-persistent oil featured here and it resulted in significantly lower environmental impacts compared to some crude oil spills listed.
A number of the incidents, despite their large size, necessitated little or no response as the oil was spilt some distance offshore and did not impact coastlines. For this reason, some of the names listed may be unfamiliar.
Exxon Valdez and Hefei Spirit are included for comparison although these incidents are further down the list. Prestige is also included for comparison.
For the year 2018, there were recorded only three large spills (>700 tonnes) and three medium spills (7-700 tonnes).
The first large spill occurred early in the new year when a tanker collided with another vessel resulting in a fire/explosion and consequently sank in the East China Sea. The second incident involved a tanker which sank in the Persian Gulf with over 1000 tonnes of cargo on board. The third large spill occurred late in the year when a tanker collided with another tanker in China resulting in a spill of oil cargo.
The first medium-sized spill was recorded in the Gulf of Guinea in February and occurred during a ship-to-ship transfer. The second one resulted from an allision and occurred in June in Europe. The third medium-sized spill occurred in Africa in November 2018 when a vessel dragged an anchor and collided with another vessel. The total volume of oil lost to the environment recorded in 2018 was ap-proximately 116,000 tonnes, the majority of which can be attributed to the incident involving the MT Sanchi that occurred in the East China Sea. This annual quantity was the largest recorded in 24 years.
Most of the existing marine engines and other fuel burning equipment in operation were specifically designed to burn HFO or MDO (Marine Diesel Oil), both of which are quite sulfurous. Design modifications and operational adjustments may be necessary for engines and equipment to use alternative fuels.
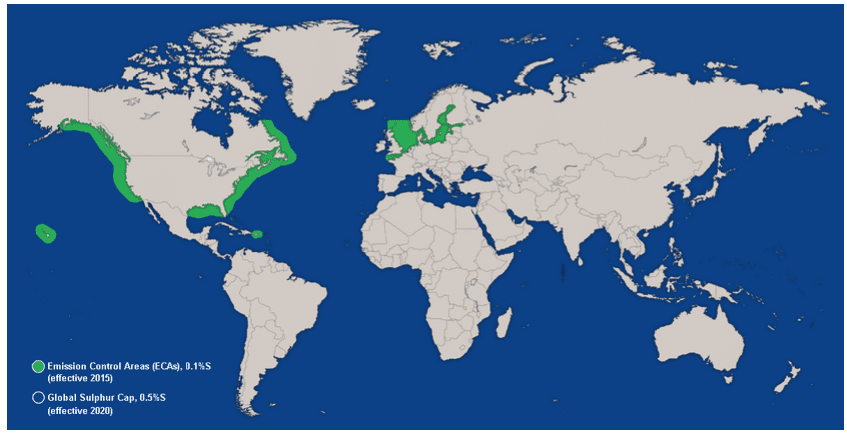
The primary international regulatory mechanism for controlling ship emissions is IMO MARPOL Annex VI, Regulations for the Prevention of Air Pollution from Ships. The regulation limits fuels with a sulfur content of up to 0.10 percent to be used within the Emission Control Areas (ECAs), or Sulfur Emission Control Areas (SECAs) from 1 January 2015 and sulfur content of up to 0.50 percent to be used globally from 1 January 2020. As defined in Regulation 2.9 of Annex VI, SOx emission controls apply to all fuel oil used in combustion equipment and devices onboard unless an approved exhaust gas cleaning system, such as (a very expensive) scrubber system, is installed. Alternatively, vessels may choose to utilize low sulfur content MGO (Marine Gas Oil) or 0.10 percent HFO (Heavy Fuel Oil) specifically developed for use in ECAs.
At present, there are four existing ECAs: the Baltic Sea, the North Sea, and the North American ECA, including most of the U.S. and Canadian coast and the U.S. Caribbean ECA (Chart 14).
Source: ALFA LAVAL
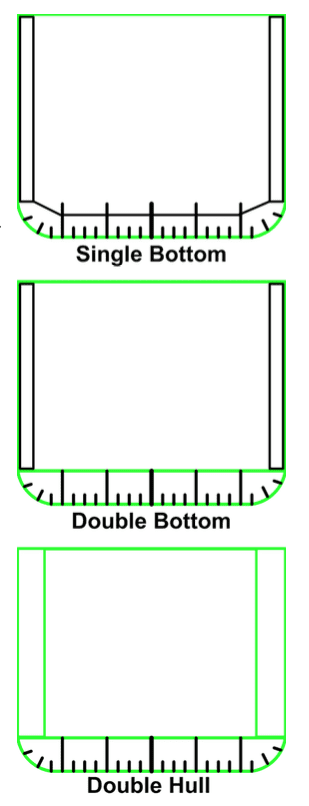
In 1992 the MARPOL Convention (the International Convention for the Prevention of Pollution from Ships) was amended to make it mandatory for tankers of 5,000 dwt and more (ships ordered after 6 July 1993) to be fitted with DH (double hulls), or an alternative design approved by the IMO (International Maritime Organization) (Regulation 13F in Annex I of MARPOL 73/78). In other words, requirements for double hulls or DB (double bottoms) had been introduced. The requirement for double hulls that applies to new tankers has also been applied to existing ships under a program that began in 1995.
The Exxon Valdez oil spill disaster in 1989 also led the U.S. Government to make double hulls compulsory for all new tanker ships coming to the U.S. ports. Largely due to public outcry following the Exxon Valdez disaster, the United States enacted the Oil Pollution Act of 1990 (OPA 90) to reduce the occurrence of oil spills and to reduce the impact of potential future spills through increased preparedness. The act included tank vessel construction standards for vessels carrying oil in bulk. Section 4115 of the act excluded SH (single-hull) vessels of 5,000 gross tons (5,513 tonnes) or greater from entering U.S. waters after 2010 (i.e., required that tankers operating in U.S. waters must have double hulls).
After the sinking of Erika off the coast of France in December 1999, IMO proposed accelerating phase-out of single hull ships. The Prestige incident of November 2002 led to further calls for amendments to the phase-out schedule for SH tankers.
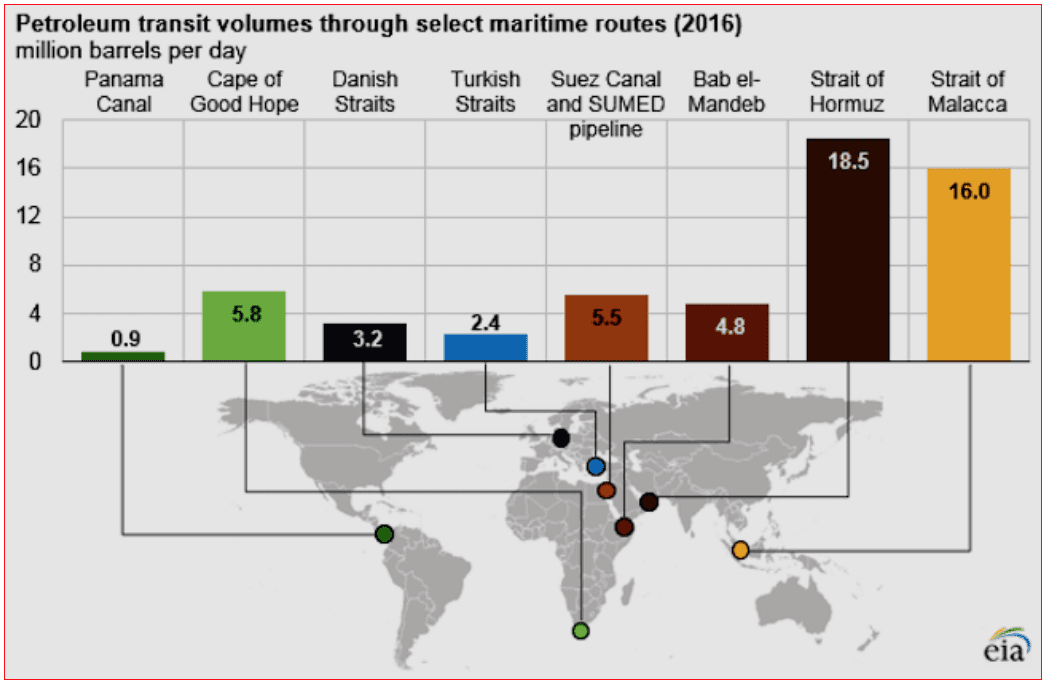
Besides, some routes are objectively highly important and dangerous for oil tankers due to the geopolitical significance and narrowness of the passage (Chart 15).
Source: Marine Insight
Forecasts
In 2017 Brussels-based SEA Europe (European Ships and Maritime Equipment Association) has predicted that in 2015-2035 oil tankers newbuilding requirement would grow, on the average, at a rate of 250 units per year, 27 mln DWT p.a., and 7.8 mln CGT p.a. This expected growth of the fleet (1.3 percent p.a. in terms of deadweight) is less than that of the global oil trade (1.8 percent p.a.) and should not create an oversupply of tanker tonnage (Chart 16).

Source: Netherlands Maritime Technology
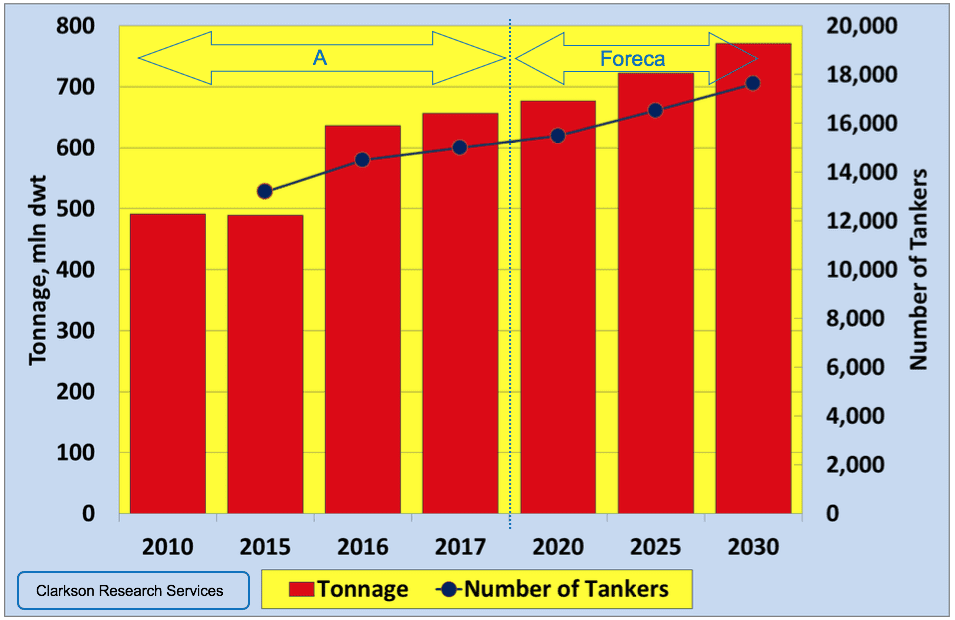
The main findings of SEA Europe forecast are in principle reproduced (of course, with thoughtful amendments) by 2030 tanker market outlook prepared by Clarkson Research Services in May 2018 and used by the UNCTAD (Chart 17).
Eugene M. Khartukov is a professor at the Moscow State Institute/University for International Relations, (MGIMO), head of the Moscow-based Center for Petroleum Business Studies (CPBS) and of the World Energy Analyses and Forecasting Group (GAPMER), and vice president (for Eurasia) of the Geneva-based Petro-Logistics S.A. He is the author and co-author of over 360 scientific publications and speaker at more than 170 international oil, gas, energy or economic fora. Email: khartukov@gmail.com.

