
A North Sea wind turbine kept producing more or less power than the forecast said it should, and the answer was hiding in the turbulence and weight of the air around its blades
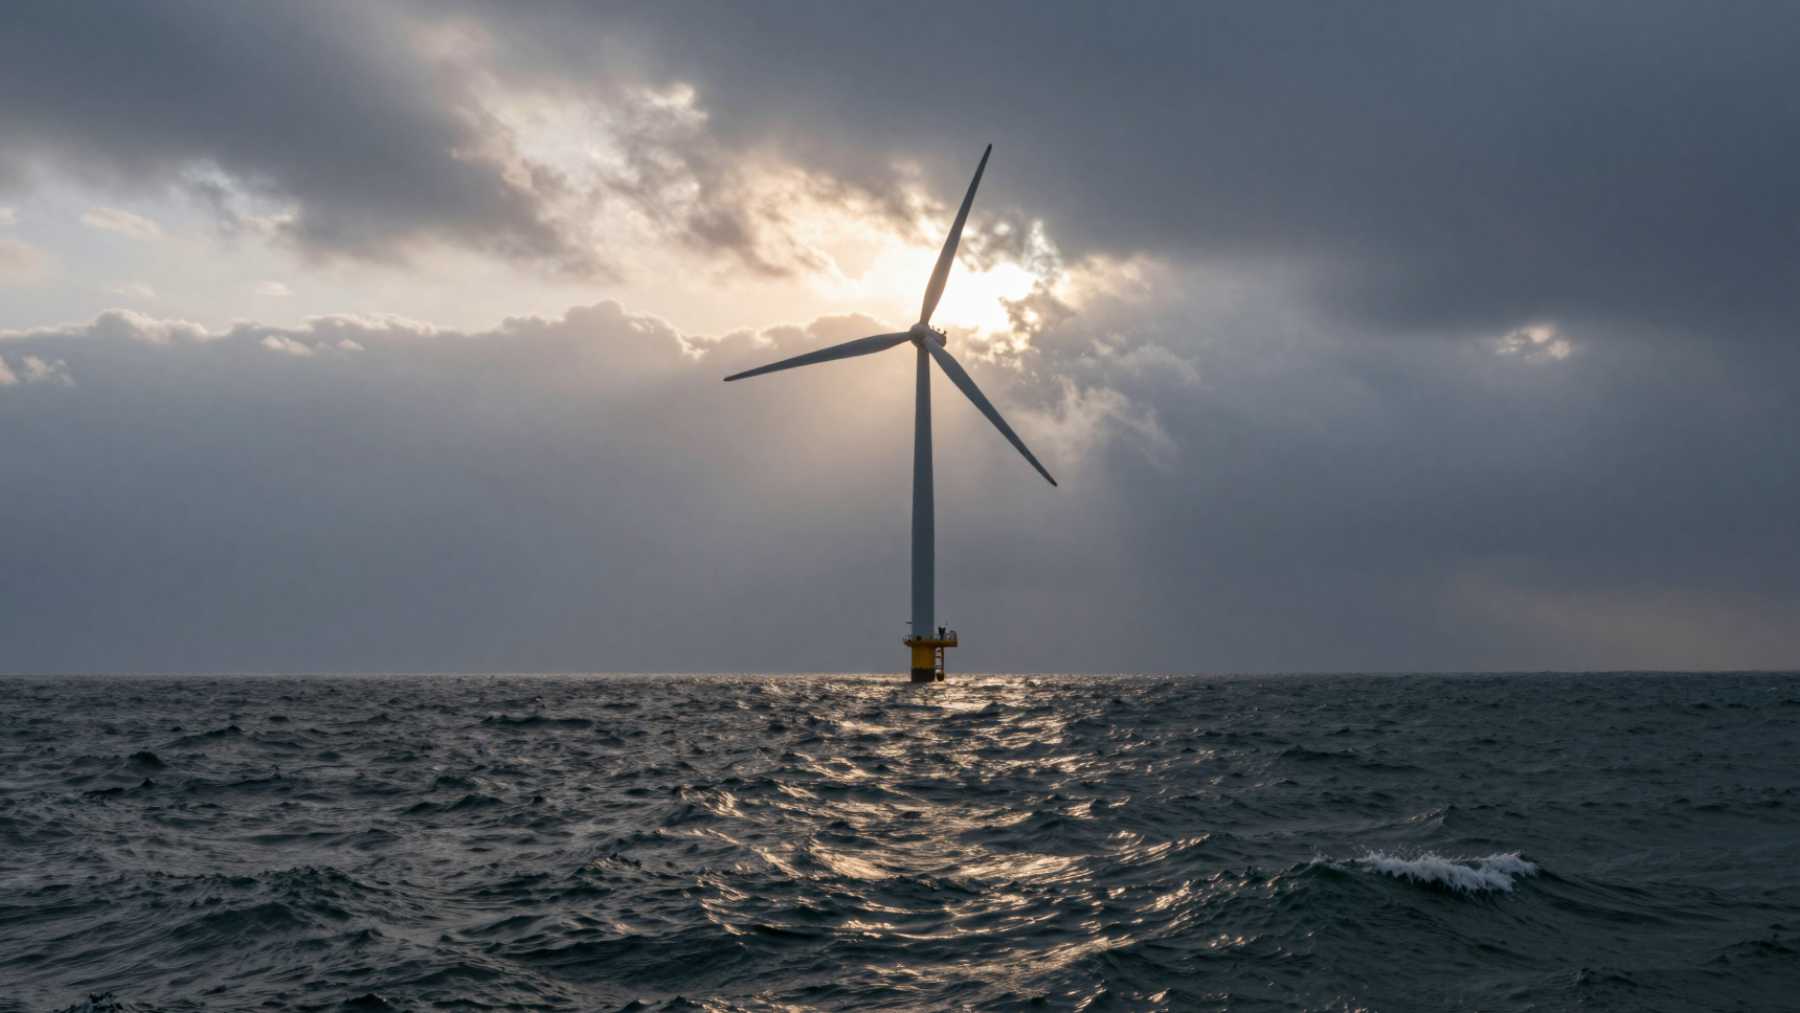
Wind speed has long been treated as the master variable of wind energy — the number that determines how much electricity a turbine will produce on any given day. But a new study of an operating offshore turbine in the Belgian North Sea suggests that assumption leaves out more than the industry has typically acknowledged.
Fitted with a nacelle-mounted lidar, SCADA systems, and a suite of environmental sensors, a single turbine quietly recorded what the atmosphere was actually doing around it. What a machine-learning framework found in that data is rewriting which variables matter most.
Wind speed alone doesn’t tell the whole story
The standard tool for predicting turbine output is the power curve — a simple relationship between wind speed and electricity generated. Feed in the wind speed, read off the power. It’s clean, intuitive, and widely used across the industry for everything from project financing to daily dispatch planning.
Incorporating turbulence intensity and air density as co-equal, regime-specific inputs in power forecasting models could meaningfully improve prediction accuracy.
Wind speed captures only one dimension of a much richer atmospheric picture. Turbulence intensity, atmospheric stability, wind shear, and air density all affect how efficiently a rotor captures energy. Researchers have known this for years. Quantifying each factor’s contribution in real operating conditions — and ranking them against one another — has proven considerably harder.
The practical stakes are real. Offshore wind farms are major infrastructure assets, and even small errors in power prediction ripple outward into grid balancing, maintenance scheduling, and the revenue projections that underpin financing agreements. A model that systematically misses key variables doesn’t just produce academic errors — it creates genuine operational and financial risk.
A turbine wired to the atmosphere
The study focused on a single commercial offshore wind turbine operating in the Belgian North Sea. Rather than relying on simulations or wind tunnel experiments, the researchers instrumented a real, revenue-generating turbine with data systems designed to capture what the atmosphere was actually doing at the rotor.
At the center of the setup was a nacelle-mounted lidar — a laser-based sensor that measures wind speed and direction at multiple points in front of the turbine, before the air reaches the blades. This gave researchers a detailed picture of inflow conditions: the wind profile across the rotor disk, turbulence structure, and how wind speed and direction changed with height. SCADA systems logged the turbine’s operational response in parallel, while environmental monitoring added data on air density and atmospheric conditions.
Using a real operational turbine matters. Simulations make assumptions; this setup captured the messy, variable reality of an offshore environment, making the findings directly transferable to industry practice in a way that lab-based studies often aren’t.
Teaching a machine to read the wind
With a rich dataset in hand, the researchers trained a machine-learning model to predict deviations from expected power output — not the absolute power level, but the gap between what the turbine actually produced and what a standard power curve would have predicted.
That gap is harder to predict than it sounds. Atmospheric variables don’t act independently — turbulence intensity, air density, and wind shear are often correlated, which makes it difficult to isolate which one is doing the work at any given moment. To solve that, the team used SHAP (SHapley Additive exPlanations), an interpretability method borrowed from game theory that fairly distributes “credit” for a model’s prediction across all its input variables. Even when inputs are correlated, SHAP can disentangle overlapping effects and produce a clear, ranked picture of what’s actually driving power deviations.
Where turbulence leads and air density takes over
The results depend heavily on which part of the power curve the turbine is operating in — and that distinction turns out to be crucial.
At partial-load operation — the torque-control regime, where wind speeds are moderate and the turbine adjusts torque to maximize energy capture — turbulence intensity emerged as the single biggest non-wind-speed predictor, accounting for 16.8% of predicted power deviation. Air density came in close behind at 14.5%. Together, these two variables dominated a region of the power curve that standard models often treat as relatively well-understood.
At above-rated wind speeds, the picture shifts sharply. In the pitch-control regime, where blade angle is adjusted to prevent the turbine from exceeding its rated output, air density became the dominant factor — contributing up to 32.8% of predicted power deviation. That’s a substantial share, and it makes physical sense: when pitch control is actively limiting power, the mass of air flowing through the rotor directly determines the aerodynamic forces on the blades. Denser air means more force. The blade pitch system can compensate, but not perfectly.
What this means for offshore wind farm operators
Current industry practice does account for air density in power curve corrections — but typically in simplified, averaged ways. This study suggests those corrections need to be more nuanced, specifically tied to whichever operating regime the turbine is in at any given moment.
Incorporating turbulence intensity and air density as co-equal, regime-specific inputs in power forecasting models could meaningfully improve prediction accuracy. No fundamental rethinking of wind farm operations is required — just better inputs to existing modeling frameworks.
The framework itself — lidar plus SCADA plus machine learning plus SHAP — is also scalable. No exotic hardware is required beyond what modern offshore turbines increasingly carry already. As more turbines are fitted with nacelle lidars and richer sensor suites, applying this kind of analysis across entire wind farms becomes increasingly feasible. What remains to be seen is whether the variable rankings hold across different turbine models, sea conditions, and geographic locations — and whether the industry moves to embed these findings into the forecasting tools that operators actually use.
If you want to learn more about these findings, you can check the complete study here: Rouholahnejad, F., Lunel, T., and Gottschall, J.: Beyond the Intersection Point: Offshore Wind and Turbulence reconstruction from Horizontally Separated Dual-Doppler Scanning Lidar Beams, Wind Energ. Sci. Discuss. [preprint], https://doi.org/10.5194/wes-2026-99, in review, 2026.


Carlos is an engineer with strong expertise in technical and industrial topics. He previously worked at international companies such as Siemens and is multilingual.
