The Federal Energy Regulatory Commission’s (FERC) Office of Enforcement Division of Energy Market Oversight presented the 2014 State of the Markets Report during a March 19 FERC open meeting. The report provided FERC staff’s assessment of natural gas, electric and other energy market developments during the past year.
According to the report, extreme cold temperatures stressed the country’s natural gas infrastructure and power markets during the first quarter of 2014. U.S. natural gas prices reached record levels resulting in electricity price spikes. Later in the year, natural gas and electricity prices were relatively low and stable. Despite low prices throughout most of the year, natural gas production continued to break records. Oil prices plunged during the second half of 2014, which has implications for oil and gas industry activity in 2015 and beyond, staff said.
The report found that spot natural gas price at Henry Hub averaged $4.32 per million British thermal units (MMBtu) in 2014, which was 16% higher than in 2013. Prices were on average 14% to 43% higher at key hubs throughout the country, with the Chicago Citygate experiencing the highest increase.
Staff said that, although prices began to moderate in the spring, concerns about low storage inventories kept prices up until early summer. Prices fell in the fall as storage recovered, and by late December, the Henry Hub price was below $3.00, they said, adding that the 43% increase in the average price at the Chicago Citygate was a result of both the high price levels during the harsh winter, and of continued reliance on natural gas supplies from Canada.
Average U.S. natural gas demand for 2014 reached a new record of 70.7 billion cubic feet per day (Bcfd), according to the report. Despite the record-cold winter, natural gas demand for electricity generation decreased by 0.5 billion cubic feet per day (Bcfd), or 3% from 2013 levels as the result of a cooler-than-normal summer, staff said.
Natural gas production grew 5% in 2014, averaging 68.4 Bcfd and breaking the record set in 2013, according to the report. Two shale formations, the Marcellus in Pennsylvania and the Eagle Ford in Texas, accounted for 34% of the production increase, averaging 14 Bcfd and 4 Bcfd, respectively. While crude oil prices fell from $115 per barrel in mid-June to $53 at the end of December, reducing drilling activity in the latter half of 2014, natural gas production continued to climb.
Staff said that there is concern that prolonged low crude oil and natural gas prices could result in slower growth or even a decline in natural gas production, but year-to-date production has consistently remained above 71 Bcfd. By the end of February 2015, production was on average 6.4% higher than in the first two months of 2014.
Natural gas exports continued to rise in 2014.
Exports to Mexico reached 2 Bcfd in 2014, up from 1.8 Bcfd in 2013, supported by the growth in Eagle Ford Shale production in South Texas and by new pipeline infrastructure across the border, according to the report. Staff said that exports will likely continue to rise as Mexican power generation demand increases, and as more pipeline capacity goes into service, including the 2.1 Bcfd NET Midstream Rio Grande pipeline, scheduled to enter service in 2016.
Plans to export LNG from the U.S. continue to move forward.
As of the end of 2014, eight projects had been approved, with four under construction, including those at Sabine Pass, expected to enter service in 2016, and at Freeport LNG, Cove Point LNG, and Cameron LNG, staff said. In addition, reliance on LNG imports continued to decrease. Send-outs from U.S. LNG terminals averaged 100 MMcfd in 2014, 67% below the 2013 levels, while imports from Canaport LNG into New England averaged 49 million cubic feet per day, 52% below 2013.
On a national level, natural gas and renewables continued to displace coal. Total generating capacity in the U.S. increased 10.8 GW in 2014, compared to a net loss of 3 GW of mostly coal and nuclear units in the year before, according to the report. The largest year-on-year change came from natural gas capacity additions, which rose by 7.7 GW in 2014, compared to a gain of 1.9 GW in 2013.
Staff said that financial liquidity in natural gas was at a five-year low in 2014. Natural gas trading volumes declined in 2014, for the fourth straight year, and financial volumes on ICE declined over 25%, in step with the drop on the Chicago Mercantile Exchange, according to the report.
Staff said that the sustained increase of natural gas production across the U.S. led to lower and more stable natural gas prices over the past several years. In addition, less volatile prices hurt speculative trading profits, which caused companies, particularly large banks, to reduce or eliminate their trading exposure. As a result, staff said, physical and financial trading has fallen significantly from its highs in 2011.
Added NG Infrastructure Curbed Winter 2015 Prices
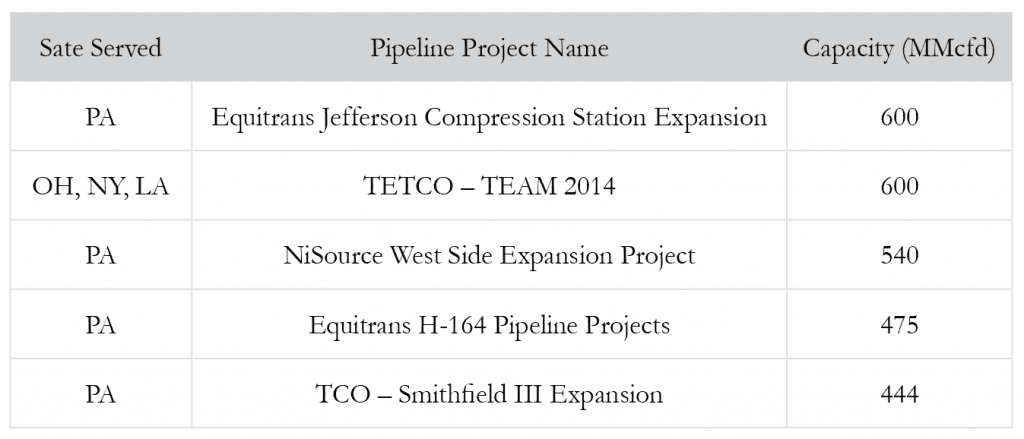
Top 5 Pipeline Projects that went Online Q4 2014
to Provide Outlet for Northeast Gas Producers

went into service in 2014 in the Northeast. Source: FERC 2014 State of the Markets Report, March 19


