Benchmark crude (oil marker) is the petroleum that serves as a pricing reference for other types of oil and oil-based securities. The benchmark makes it easier for traders, investors, analysts, and others to determine the prices of multitudes of grades of crude oil varieties and blends. Using benchmarks makes referencing types of oil easier for sellers and buyers.
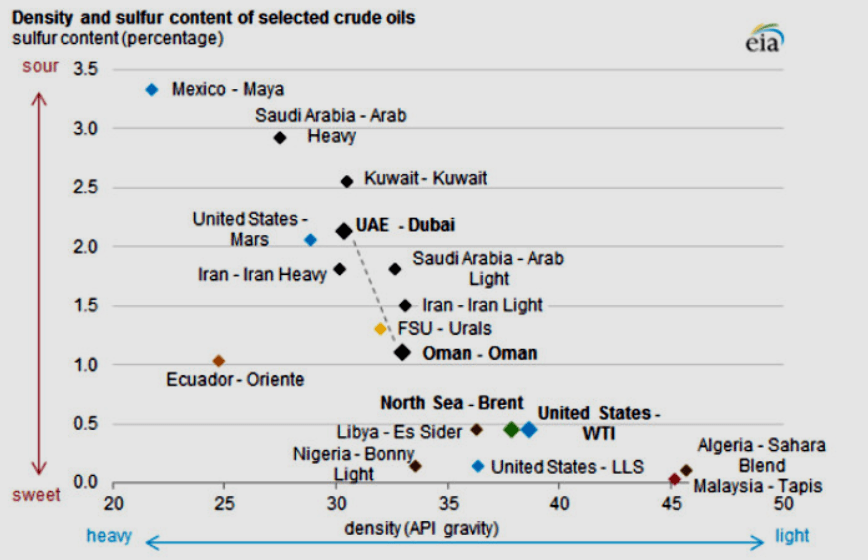
There is always a spread between WTI, Brent and other blends due to the relative volatility (high API gravity is more valuable), sweetness/sourness (low sulfur is more valuable) and transportation cost – the price that controls world oil market price.
Brent blend is a light (38.06° API), sweet crude (0.37% sulfur by weight). Some 15 U.K. fields in the Brent-Ninian area in the northern North Sea contribute to the blend, although very little production comes from the once-prolific Brent field, after which the stream was named. The Brent blend is transported to the Sullom Voe terminal via pipelines. This terminal, representing an inlet between North Mainland and Northmavine on Scotland’s Shetland Islands, is operated by Enquest, which acquired a three percent stake and the operatorship of the terminal from BP in 2017. Despite the declining physical volumes associated with the Brent blend (a peak of 1.3 mln b/d in 1985, less than 0.5 mln b/d in 2000, 75.5 kb/d in 2018 and forecast 58.1 kb/d in 2020), its importance as a financial oil benchmark is increasing (though seriously questioned now). Therefore, between 2002 and 2015 a series of changes were made to Dated Brent in an effort to maintain its liquidity and status – by increasing the available volume (some crudes were added and its delivery window was repeatedly widened).
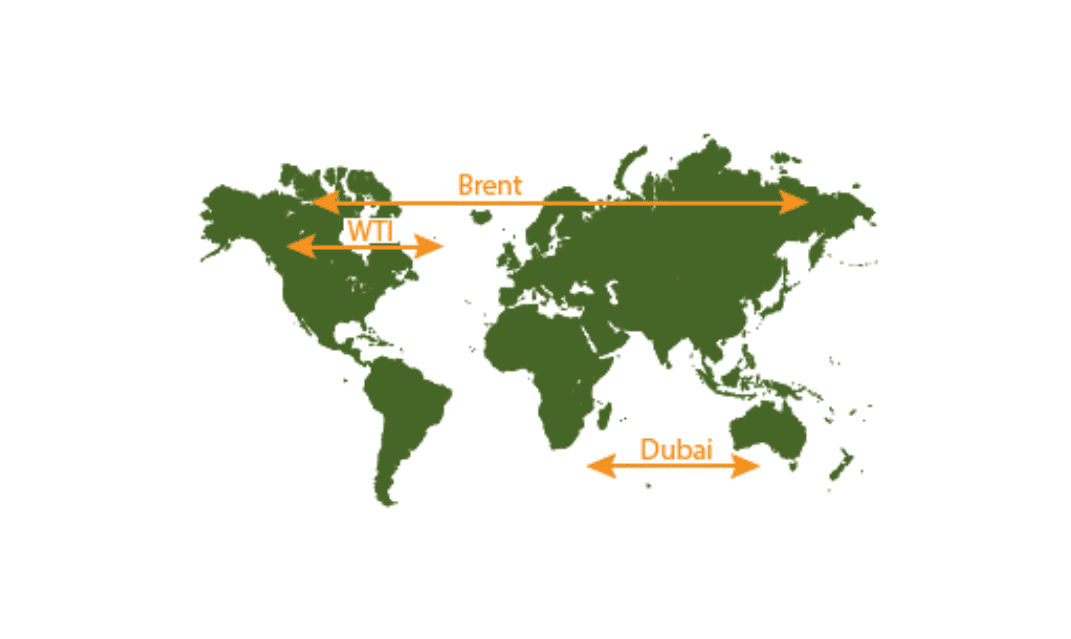
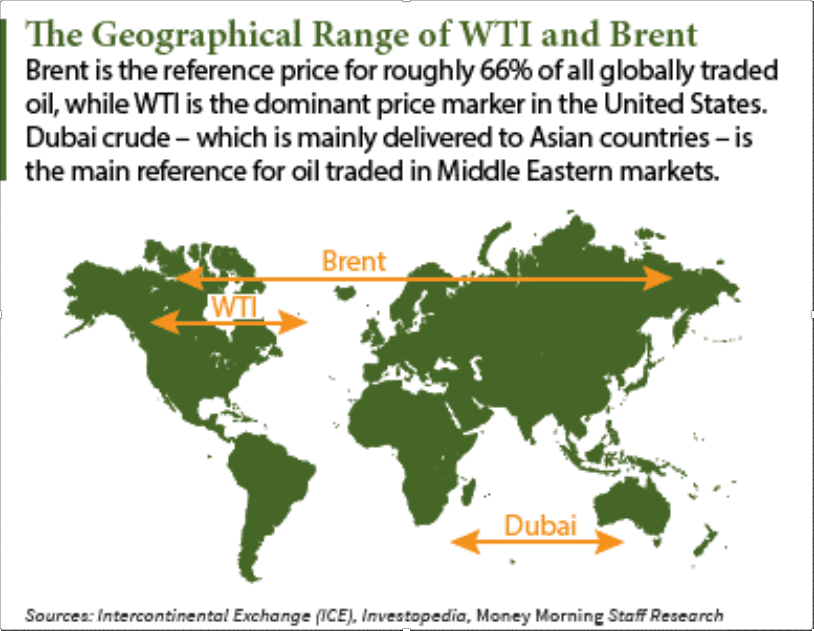
Generally speaking, three major markers used in pricing of crude oil across the globe are WTI (Western Texas Intermediate) for the American markets, Brent for the European/West African Markets and Dubai or OD (Oman/Dubai) crude oil grades used for Persian Gulf and the Asian markets.
Crude oil benchmarks are reference points for the various types of oil that are available in the market. Also known as oil markers, crude oil benchmarks were first introduced in the 1980s, with the aim of establishing a standard for the world’s most actively-traded product. At present, there are dozens of different oil benchmarks, with each one representing crude oil from a particular part of the globe. However, the price of most of them are pegged to one of the following three primary benchmarks: Brent, WTI or OD. Roughly two-thirds of all crude contracts around the world reference Brent Blend, making it the most widely used marker of all.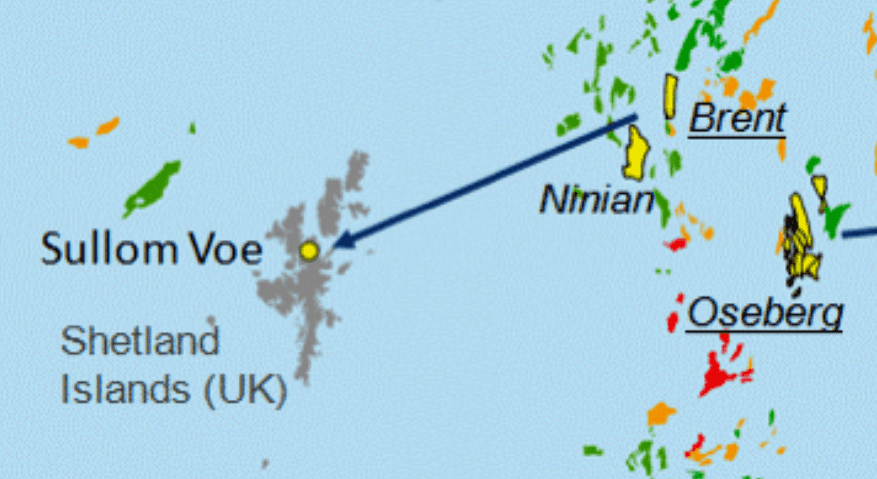
Other well-known oil markers include the OPEC Reference Basket used by OPEC, Tapis Crude which is traded in Singapore, Bonny Light used in Nigeria, Urals oil used in Russia and Mexico’s Isthmus as well as Canada’s Western Canadian Select (WCS) and Edmonton Par crude.
WTI, known also as Texas Light Sweet crude, is referred to as the oil extracted from oil fields and wells in the U.S. and is landlocked. The crude is transported via pipelines and hence one of the drawbacks as it is fairly expensive to distribute and sell to other parts of the globe. This crude is light and ‘very sweet’ (API gravity 39.6°, sulfur content 0.4-0.5 % by weight). WTI is pumped to Cushing hub in Oklahoma and is a benchmark for crude mainly in the United States.
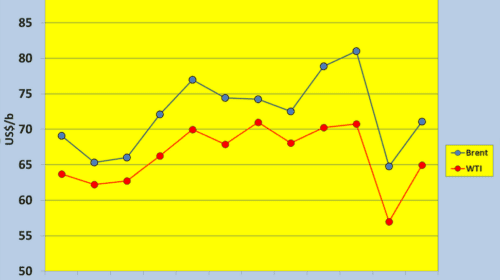
Historically, price differences between Brent and other index crudes have been based on physical differences in crude oil specifications and short-term variations in supply and demand. Prior to September 2010, there existed a typical price difference per barrel of between ±3 USD/bbl compared to WTI and OPEC Basket; however, since the autumn of 2010 Brent has been priced much higher than WTI, reaching a difference of more than $11/b a barrel by the end of February 2011 (WTI: 104 USD/bbl). In February 2011 the divergence reached $16/b during a supply glut, record stockpiles, at Cushing, Oklahoma before peaking at above $23/b in August 2012. It has since (September 2012) decreased significantly to around $18/b after refinery maintenance settled down and supply issues eased. In 2018, on the average, this price premium in relation to WTI stood at over US$6.1/b (Chart 1).

Dubai/Oman refers to the crude oil produced in Middle Eastern countries and is lower grade than Brent or WTI. It has high sulfur content and is procured in Dubai, Oman and Abu Dhabi. This is the benchmark for the Persian Gulf production and is mainly sent to Asia (Chart 2).
Tapis Crude: It is the benchmark for light sweet Malaysian crude. The sulfur content is as low as 0.03% and the API gravity is around 45.5. Although this oil marker is not as widely traded as WTI, it is used as a benchmark in Asia.
Bonny Light: It is a benchmark for high grade Nigerian crude, with an API of around 36. Due to its very low sulfur content, it corrodes the refinery infrastructure minimally.
Isthmus: This is the crude oil benchmark for light crude produced in Mexico. The sulfur content is around 1.45% and the API gravity is 33.74º.
The OPEC Reference Basket (ORB), also referred to as the OPEC Basket, was initially introduced at the start of 1987 and was originally the pricing data formed by collecting seven crude oils from the OPEC nations (except Mexico). These included, on an arithmetic basis, the spot prices of Saudi Arabia’s Arab Light, Algeria’s Saharan Blend, Indonesia’s Minas, Nigeria’s Bonny Light, Venezuela’s Tia Juana Light, Dubai’s Fateh and Mexico’s Isthmus. This information was used by OPEC to monitor the global conditions of the oil market. Since June 16, 2005 (decided by the 136th OPEC Conference), the OPEC Reference Basket of Crudes (ORB) was the production-weighted average of 14 (since June 2018) it composed of the following 15 crudes: Saharan Blend (Algeria), Girassol (Angola), Djeno (Republic of Congo), Oriente (Ecuador), Zafiro (Equatorial Guinea), Rabi Light (Gabon), Iran Heavy (Islamic Republic of Iran), Basra Light (Iraq), Kuwait Export (Kuwait), Es Sider (Libya), Bonny Light (Nigeria), Qatar Marine (Qatar), Arab Light (Saudi Arabia), Murban (UAE) and Merey (Venezuela). As of June 2005, ORB’s API gravity was 32.7° and its sulfur content – 1.77% by weight.
In 2007-2018 the following changes have happened to composition of ORB:
- As of January 2007: The basket price includes the Angolan crude “Girassol”
- As of 19 October 2007: it includes the Ecuadorean crude “Oriente”
- As of January 2009: excludes the Indonesian crude “Minas”
- As of January 2009: the Venezuelan crude “BCF-17” was replaced by the crude “Merey”
- As of January 2016: the basket includes the Indonesian crude “Minas”
- As of July 2016: it includes the Gabonese crude “Rabi Light”
- As of January 2017: excludes the Indonesian crude “Minas”
- As of June 2017: includes the Equatorial Guinean crude “Zafiro”
- And as of June 2018: includes the Congolese crude “Djeno”
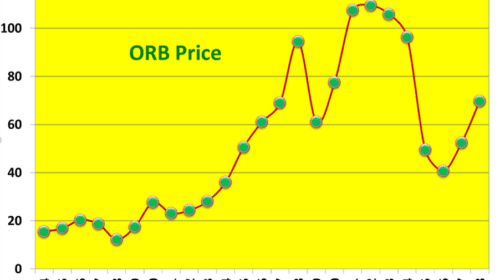
In 1994-2018 annual average price of ORB has increased 4.5-fold: from $15.53 per barrel on the average of 1994 up to $69.78/b in 2018 (Chart 3). At the very end of 2018 ORB average price stood at $51.55/b and was growing.
Edmonton Par and Western Canadian Select (WCS) are benchmarks crude oils for the Canadian market. Both Edmonton Par and West Texas Intermediate are high-quality low-sulfur crude oils with API gravity of around 40°. In particular, Par crude, delivered at Edmonton, Alberta, has 40.02° API gravity and 0.3% sulfur. In contrast, WCS, blended at a storage terminal in Hardisty, Alberta, is a heavy and sour crude oil with an API gravity of 20.5 to 21.5° (925 to 935 kg/m³) and sulfur content of 3.0 to 3.5% by weight.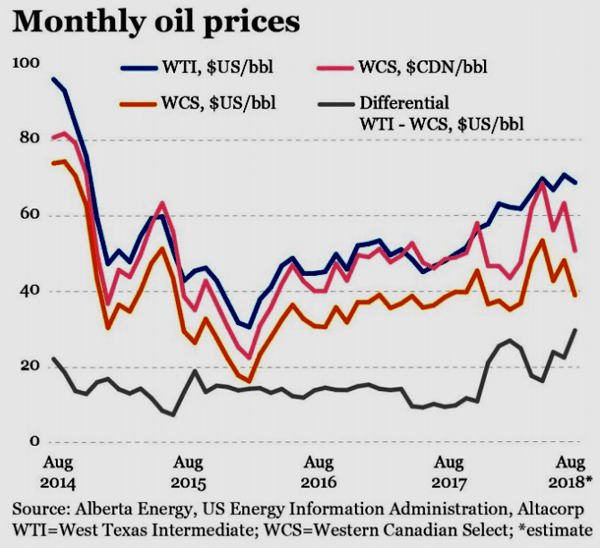
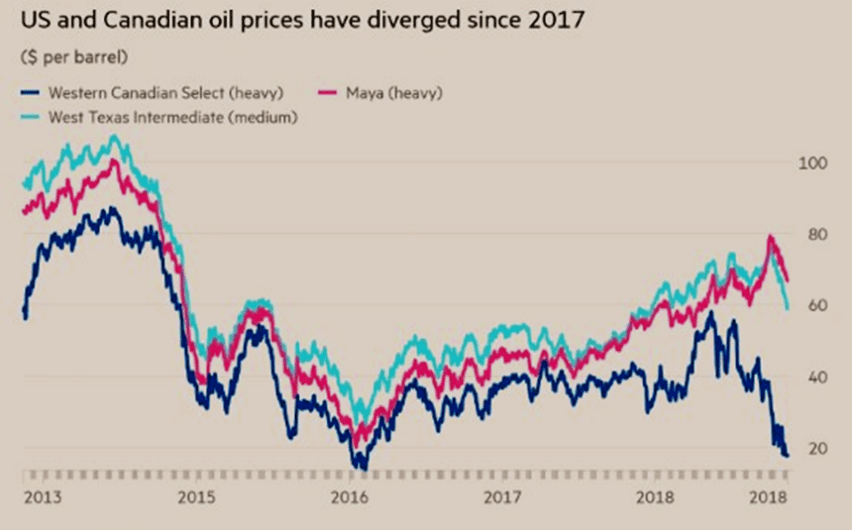
Western Canadian Select (WCS) trades at a considerable discount to WTI (up to US$30/b at the end of 2017). But the gap started to widen in 2018 as U.S. refinery capacity was rising (Chart 4).
For Edmonton Light, the discount jumped to U.S. $7.32 per barrel in January, after averaging U.S. $3.93 in Q4 2017, and this discount was expected to narrow to around US$3.50 by 2019.
The Canadian Crude Index (CCI) serves as a benchmark for oil produced in Canada. It allows in-vestors to track the price, risk and volatility of the Canadian commodity. The CCI provides a fixed price reference for Canadian crude oil and provides an accessible and transparent index to serve as a benchmark to build investable products upon, and could ultimately increase its demand to global markets. The CCI was launched by Auspice Capital Advisors in 2014 and can be used to identify opportunities to speculate outright on the price of Canadian crude oil or in conjunction with WTI to put on a spread trade which could represent the differential between the two. Currently, Canadian oil trades at a discount to WTI. The landlocked location and transportation constraints of crude oil in Western Canadian provinces contribute to this discount.
Also, until 1986, Arab Light (or shortly AL) price (32. 8° API (0, 8602 г/см3; OPEC sources insist on 34° API; sulfur content – 1. 97 %) was a leading oil marker and a technical reference, to which all OPEC’s other oil prices were linked. In early 1986 Saudi Arabia adopted net-back pricing and AL price was replaced as the world oil czar by Brent blend spot prices (Chart 5).
Furthermore, until 2009 Indonesia’s Minas crude (also referred to as Sumatran Light) and comes from the island of Sumatra. Its API gravity is approximately 35° and the specific gravity is 0.8498; sulfur content of only 0.08%) was an oil marker for up to 1 million b/d of Indonesian, Vietnamese and Sudanese crude, a legacy from an era when Minas, which began commercial production in the 1950s, was the largest oilfield in Southeast Asia. However, its output, once above 400,000 b/d, has fallen by mid-2008 below 200,000 b/d (and, perhaps, as low as 150,000 b/d due to the ageing field’s natural decline) and less than 50 kb/d of Minas oil was available for exports.
Malaysian Tapis crude with an API gravity of 42.7° and with only about 0.04% sulfur is also under the question as a Pacific/Asia oil marker as its production currently naturally declines (from a maximum of 360,000 b/d to around 280,000 b/d now). While it is not traded on a market like Brent or WTI, still it is often used as an oil marker for Asia and Australia. Tapis oil has previously filled the role of regional light sweet benchmark, powering the APPI index system that was widely used in In-donesia, Australia and Vietnam.
The price of Tapis in Singapore is often considerably higher than the price of benchmark crude oils such as Brent or WTI. This is because its greater aromaticity (i.e., higher °API) allows for greater production of higher-value products, such as petrol (gasoline), than from Brent or WTI. Its high price is also due to the purity of the blend. Because it contains less sulfur, it requires less refinery processing than sourer crude oils such as Brent crude and WTI.
Alaskan North Slope (ANS) crude blend (a relatively high viscous – 23.9cSt @50°F –- and quite heavy – 29.6° API) is also considered as a Pacific oil marker but its production (over 2,000 kb/d in the second half of the 1980s) is falling (down to below 500 kb/d in 2020, according to forecasts).
Urals blend, which is a mixture of crudes produced in Volga-Urals and Western Siberia with its sulphur content of 1.3-1.8% and specific gravity at 20°C – 850.1-870.0 kg/m3 and at 60°F – 853.7-873.5 kg/m3 (≈ 30.5-34.5°API) pretends to become a global oil marker, although the bulk of this crude is known to be sold within term contracts with a few European buyers. Urals trade has been fanfare-ously launched in Moscow on SPIMEX commodity exchange in late November 2016 as a long-awaited genuine benchmark crude. But, with the known inertia and limitations, it is actually a forcebly introduced local and invalid oil marker, which is unlikely to become most widely (globally) used in any foreseeable future. Interesting to note that 2006 already saw the first attempt to create a tradeble futures contract for the Russian export crude – under the name of REBCO (Russian Export Blend Crude Oil), which started to be traded on the NYMEX. However, the contract did not gain popularity among oil traders (number of trades was extremely limited) and was eliminated in 2012.
Also, ESPO blend, which is sold from Kozmino terminal in the Russian Far East and has, according to Platt’s, sulfur content of 0.54% and gravity of 34.7°API, may become a Pacific oil marker in the future but it is not traded yet on any commodity exchange that provides the needed liquidity and the price’s transperancy.
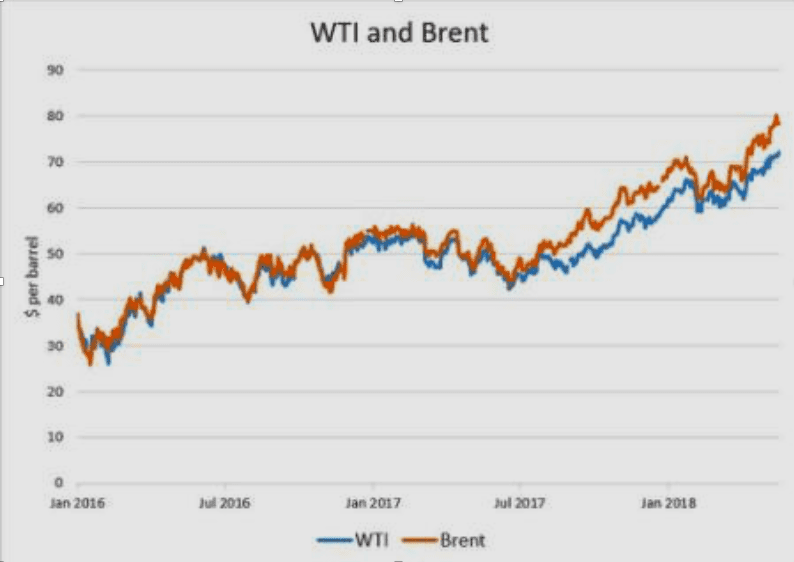
2016-2018, in US$/bbl / Source: Yahoo Finance
In response to accusations that Brent price was manipulated by some oil traders (Platt’s was ready and eager to take a killing legal action against those who publicly disseminated such accusations). The leading oil-price agency has developed an InterContinental Exchange (ICE) introduced in early July 2015. The so-called BFOE Index, which is the volume-weighted average price of trading in the 21-day Brent Blend and Forties (UK), Oseberg and Ekofisk (Norway) (and since 2018 also Norway’s Troll crude) ‘cash’ or forward market in the relevant delivery month as reported and confirmed by industry media and is an average of second month cargo trades in the 21-day BFOE market plus or minus a straight average of the spread trades between the first and second months.
In the same vein, Argus Media launched in May 2009 and publishes daily now Argus Sour Crude Index (or shortly ASCI), which is based on sour oil production in U.S. Gulf of Mexico (offshore Lousiana), and is a useful pricing tool used by buyers, sellers and traders of imported crude oil for use in long-term contracts and has been adopted as the benchmark price for sales of crude oil by Saudi Aramco (in 2009), Kuwait (in 2009) and Iraq (in 2010).
Contracts based upon ASCI are listed on the world’s two largest oil exchanges, the New York Mercantile Exchange (NYMEX) and the Intercontinental Exchange (ICE).
Oil markers’ price dynamics are well correlated but not to a full extent – reflecting oil balances of their own markets (Chart 6).
Talking about the prerequisites (preconditions) of oil markers, it would be useful to look at the table, showing the compliance with them of Brent and Urals oil blends (Table 1).
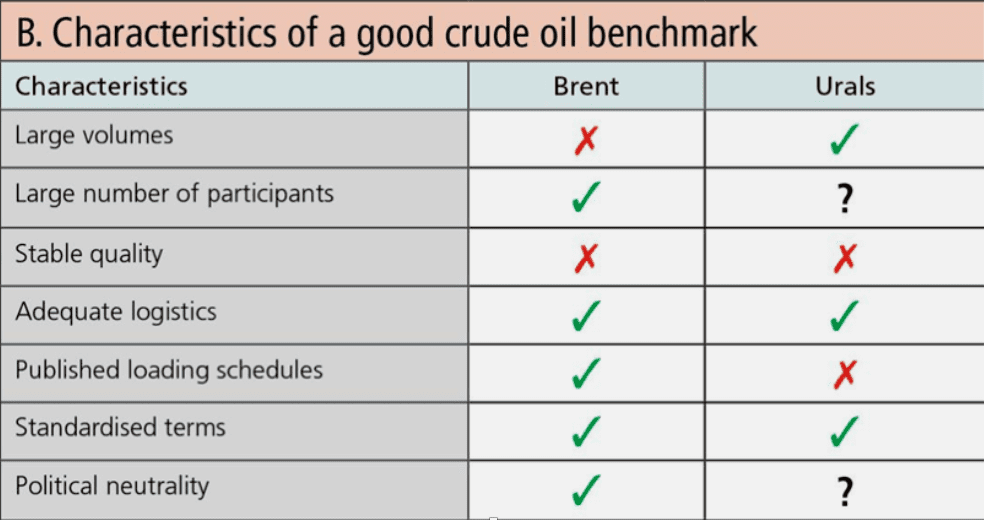
Source: ICIS complied from Liz Bossley, 2018
Eugene M. Khartukov is a professor at the Moscow State Institute/University for International Relations, (MGIMO), head of the Moscow-based Center for Petroleum Business Studies (CPBS) and of the World Energy Analyses and Forecasting Group (GAPMER), and vice president (for Eurasia) of the Geneva-based Petro-Logistics S.A. He is the author and co-author of over 360 scientific publications and speaker at more than 170 international oil, gas, energy or economic fora. Email: khartukov@gmail.com.

