A Troubled Year
To date, 2020 was one of the most challenging years for a majority of businesses, and the oilfield industry was no exception. Since the beginning of last year, over 15 companies have been bought or merged, while over 30 companies have filed for Chapter 11 bankruptcy. However, many companies have taken steps to remain competitive and operational.
Benjamin Franklin famously said, “But in this world nothing can be said to be certain, except death and taxes.” If you have been in the industry for any significant amount of time, you may argue that market volatility in the oilfield is certain. Operators overextend their assets based on models’ predictions that continue to fail the bottom line with underperformance. This is often paired with increased costs on innovative completions design programs that, aside from production changes, lack true validation. During downturns, outdated upper management slashes innovation budgets while technology improvements remain stagnant and contribute little true value. This is another Groundhog’s Day the industry cannot afford.
Thousands of unemployed oilfield workers are left thinking, “What if we did things differently?” Times are changing and so should the way we operate as an industry. To stay competitive, energy companies must continue to employ innovative technology.
A New Technology
Deep Imaging, a controlled-source electromagnetics company based in Tomball, Texas, has homed in on an innovative technology, which allows operators to make game-changing decisions during their fracking operations through using real-time frac fluid imaging. This is done through an array of highly sensitive nano-voltmeter receivers and a grounded dipole system laid directly over the wellbore trajectory completely off the pad. On the surface, a direct measurement of frac slurry magnitude and direction is measured then displayed as polygons taking shape over the stimulated rock area. The result is a 2D image shown in a map view. A transmitter capable of injecting 200 kilowatts of power into the ground is utilized to transmit a signal via a grounded dipole. The receivers on the surface are laid out with cables connecting two rods in the ground that measure electric potential. A swath of receivers is turned on over the stage being fracked and records a baseline measurement before fracking commences. Voltage changes are measured at 50,000 samples per second during the frac, then signals are processed for data quality. Following processing, the baseline signal is subtracted from the recorded signal giving the final image result.
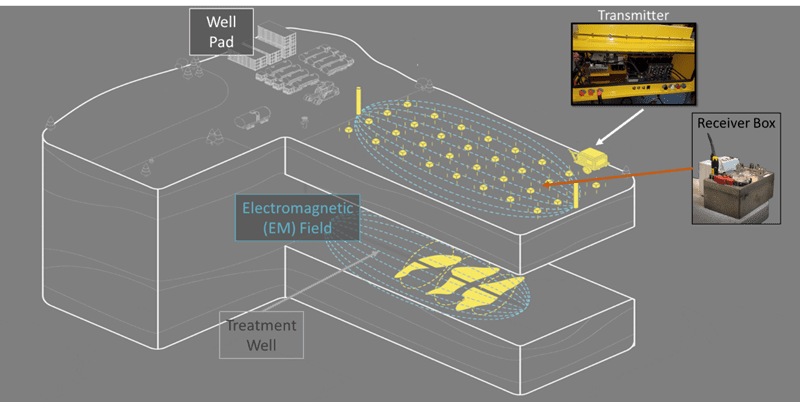
The schematic in Figure 1 explains how this deployment is configured. The yellow cylinders represent the transmitter wire grounding points, and the yellow boxes represent the deployed receivers. The blue dotted lines represent the interaction between two electromagnetic fields – one from the transmitter that the horizontal wellbore casing responds to, which is perturbed by the second one caused by the frac. This amplifies the frac response and is recorded by receivers. The baseline signal recorded is the response of the well’s casing alone, which through subtraction, allows for isolation of the frac response.
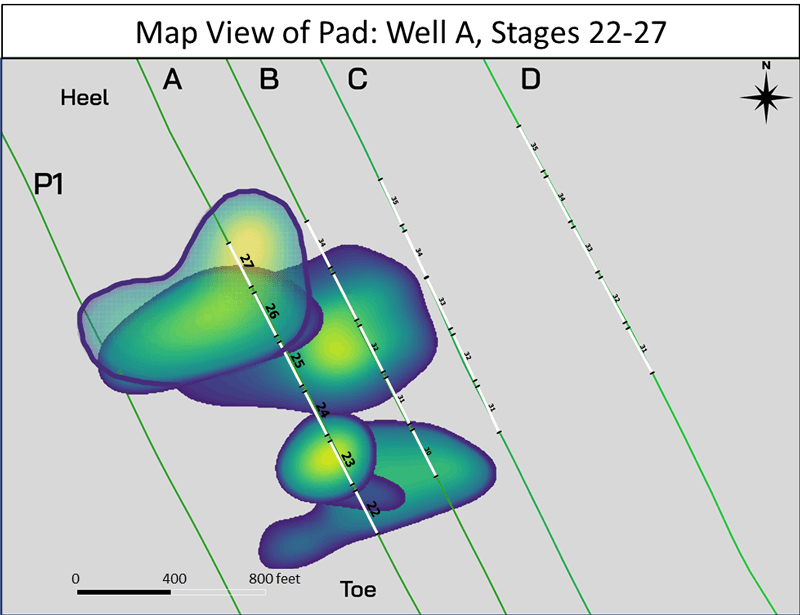
What does this all translate to? What kind of data does this technology provide? First and foremost, a map view of the data produced is shown in Figure 2. This map view can help companies mitigate or prevent frac hits. In Figure 2, the polygons in the viridis color palette ranging from blue (weak signal) to yellow (strong signal) show the signal migrating west to a parent well (P1). These images allow for a significant depth of analysis to gather trends and predictions for future completion stages, including frac azimuth and extent, as well as correlations of fluid response with corresponding completions data. Additionally, the data can be analyzed in complement with microseismic for more extensive insights.
Successful Real-Time Implementation
Originally, Deep Imaging’s technology was developed with retrospective imaging. Stages were delivered to the operator a month after data acquisition. However, Deep Imaging had a successful trial in September 2020 where imaging was delivered within three hours of each stage’s end. On the final stage, the team generated images 20 minutes after the stage had started. This means if the operator saw any signs of plug failures, extreme overlap into previously fracked stages or runaway propagation toward a parent well, they could alter the impact of that stage while it was being pumped. No more waste. No more frac hits.
The primary goal of this assessment was to gain an understanding of stage to stage interactions. The scope of the operation is in Figure 3.
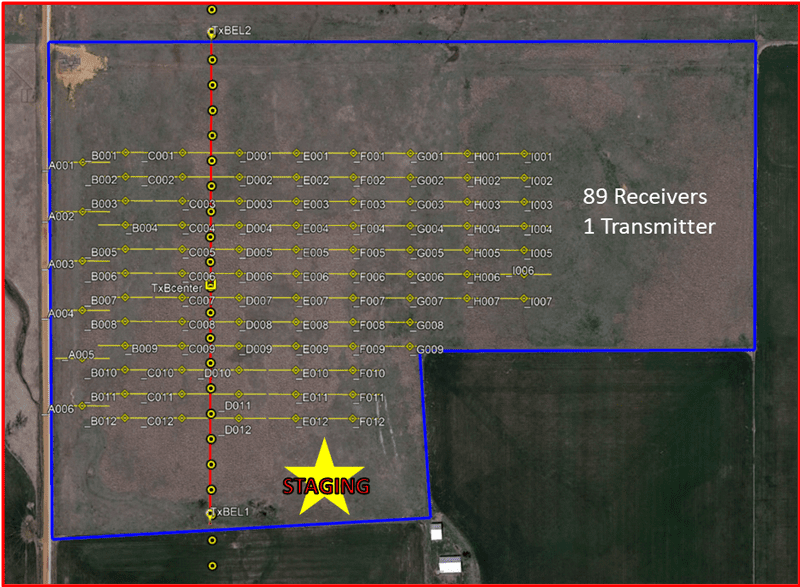
In the map view above, the red line represents the transmitter and the horizontal yellow lines represent the full sensor dipole or receiver array. There were parent wells to the west and depletion effects were expected. However, using this technology, Deep Imaging determined that the stages were biased more toward the east than toward depletion zones. This was possibly due to a stress-conduit effect, where previous nearby stages from the opposing well created a path of least resistance for stages to propagate toward. In addition, frac azimuth and extent were observed, where azimuth corresponded with client model predictions as well as microseismic readings taken in the area. Stage overlaps and the percentage between the actual stimulated area versus what was expected were assessed for wasted time and materials. For detailed analysis, refer to Figure 4.
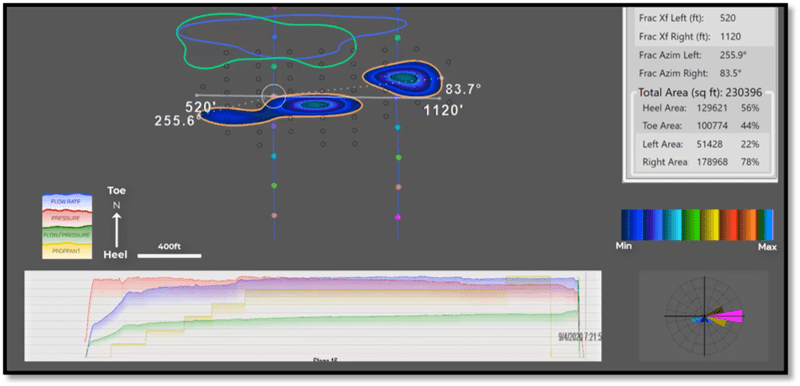
Figure 4 illustrates the informational changes using this technology over time. In real-time, Deep Imaging provides calculated frac length and azimuth. This is seen in the table in the upper right corner of the image. It includes corresponding measurements on the frac polygon and rose diagram in the lower right corner. The outlines of previous stages, the calculation of the total area covered by the frac stage, and frac skewness are also automatically provided.
Building Symbiotic Partnerships
Deep Imaging is converting its traditional practices into an updated, real-time system to service larger scale zipper frac operations. The company partners its technology services with companies who want to revamp their completions design strategy and actively respond to undesired frac events, resulting in true, real-time cost savings. This is especially needed during economically challenging times. The industry needs symbiotic partnerships with technology service companies to make it through this downturn. Working together, the oilfield will weather the storm and emerge stronger than ever.
Headline photo courtesy of Deep Imaging
Sam Young is a completions engineer at Deep Imaging. He helps Deep Imaging’s partner operators address and solve problems they are facing with their completion development strategy. With a wide range of industry experience in horizontal completions, operations and reservoir engineering, Young excels in unconventional design optimization, data analytics and enhancing well performance. He holds a BS degree in petroleum engineering with a minor in mechanical engineering from Texas Tech University. Contact: samyoung@deepimaging.com.

