The beginnings of the digital transformation effort of the oil and gas industry can be traced back at least a decade when many of the oil majors started their initial efforts on smart fields. Different oil majors had various names for this concept – Shell called it Smart Fields, Chevron named it Intelligent Oil Fields, bp referred to it as Field of the Future – but the basic premise was the same: data combined with software and technology would enable autonomous, continuous optimization of oil fields. The underlying technology enabling smart fields is known as closed-loop reservoir management, and is described in Figure 1 below.
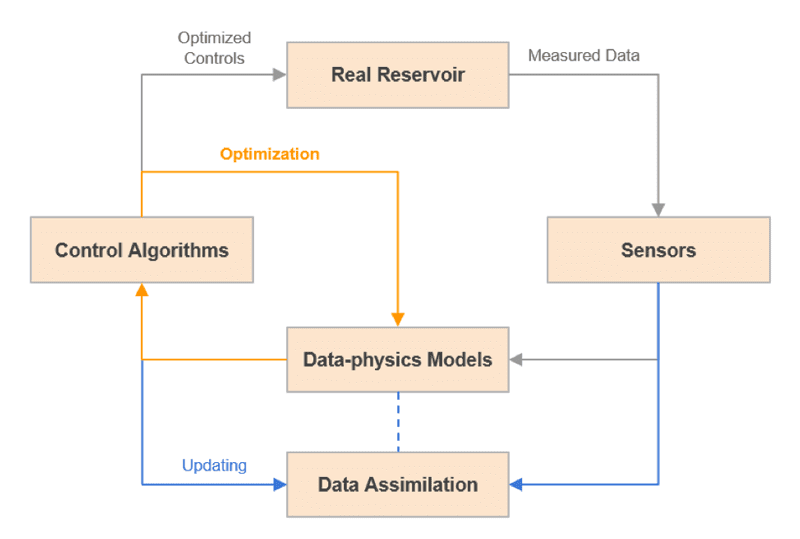
The Real Reservoir box represents the real oil field over which one or more objectives needs to be optimized. In a typical application, it might be net present value or cumulative oil produced. The optimization is carried out by finding the optimal values of a set of control parameters including, for example, well rates for injection optimization and well locations for infill drilling optimization. The Models box represents approximate models that are mathematical representations of the real reservoir. These could be complex simulation models, analytical models or machine learning models that relate the control variables to the objective functions. Since our knowledge of the reservoir is generally uncertain and data is noisy, the models and their output are also uncertain. The closed-loop process starts with an optimization performed over the current models to maximize or minimize the objectives.
The optimization provides optimal settings of the controls for the next control step. These controls are then applied to the real reservoir over the control step, which impacts the outputs from the reservoir (such as water cuts, BHPs, etc.) which are measured. These measurements provide new information about the reservoir, and therefore enable the models to be updated (and model uncertainty to be reduced). The optimization can then be performed again on the updated model over the next control step, and the process repeated over the life of the field.
We have come a long way since the beginnings of the smart field and digital transformation revolution, and COVID-19 has further accelerated the adoption of digital transformation. However, with data being the backbone of such a transformation, one of the key impediments to this digital transformation process has been the lack of standardized, high quality, easily accessible data in a timely manner, making it difficult to realize the full potential of digital transformation. Particularly with respect to closed loop optimization, high quality and timely data is critical to ensure that the models are always “green” and reliable, and therefore the optimizations based on them are reliable; otherwise, implementation of these “optimal” decisions would be disastrous.
Among the many kinds of data being measured in oil fields, production data are probably one of the most important types, particularly because the economic viability of an oil field depends directly on production. Additionally, well and layer level production data are required for most engineering workflows and even for regulatory purposes like reserves reporting. Well level production is typically measured via well tests; however, such well tests are generally quite infrequent due to the cost, production disruption and manpower needed to conduct them. Further, layer level measurements are even more difficult and rare, as they require running very expensive production logging tools (PLTs) that completely disrupt production and often are even not possible due to wellhead jewelry. As such, there is a need to allocate production to the wellhead and layers on a daily basis that is consistent with total production measured at the sales or distribution points.
Current approaches to surface allocation balance fluid input and output over the surface network so that inputs, outputs and inventory changes in the network are in balance for the selected quantity measure (volume, mass, energy). Proportional allocation is the most common method used to allocate production, where the well tests are normalized to the sales and distribution point data. This proportional approach is very simplistic and has a few key limitations:
- Inability of current methods to account for the physics of fluid flow in the surface network from the wellhead to the delivery point can lead to inaccurate allocations.
- Current approaches mainly use well test data to calculate allocations, which are then applied over periods of time, until the next well test is available. They don’t use all available data, such as pressure and temperatures over the surface network, which are usually more frequently available than well test data.
- Current approaches assume that allocation factors remain constant over periods of time when in reality several factors, like wellhead pressure and injection-producer interaction, generate significant changes, making the allocation a dynamic process which needs to be continuously calculated.
Using state-of-the-art machine learning and data assimilation approaches with well-known physical models and correlations, it is possible to significantly improve over the current approaches to continuously calculate daily oil, water and gas rates at every wellhead and other network nodes that match all measured historical well tests, pressure and temperature data. Furthermore, such approaches can be operationalized using the power of cloud and edge computing.
Figure 2 shows a surface network with 21 wells and one gathering station. This network is simulated with a full physics-based network simulator to create a test data set to compare the different approaches to allocation.

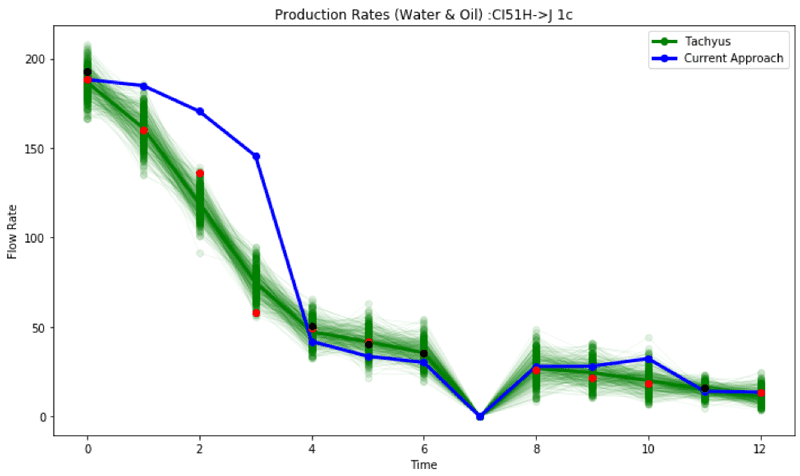
Figure 3 shows how employing such a comprehensive approach can lead to better allocation. Red is the “true” data created with the simulator and is hidden from the proposed approach, black is the well tests, blue is the allocation based on current approach, and the green ensemble is the result of applying an ensemble estimator to a physics-based network model to perform the allocation. It is clear that such an approach leads to much better allocations over a traditional allocation.
Similar to the surface allocation problem, the current approaches to layer level allocation are also usually quite simplistic and have many issues.
- The most common approach is static KH (permeability*thickness) based allocation, which can again lead to erroneous results.
- Since injection rates, production rates and connectivity are dynamically changing, there is a need to do layer level allocation on a continuous basis, which is impractical with current approaches.
- Current approaches are deterministic in nature and do not account for uncertainty, which is necessary for reliable results.
- This process can be very time consuming and inaccurate if done manually, which is currently the norm in the industry.
Again, combining state-of-the-art machine learning and data assimilation approaches with well-known physical models, layer level allocation can be improved significantly, to provide fully automated, unbiased, layer level production and injection rates on a daily basis. Such an approach was tested using a data set from a real field. The field has 98 active producers and 42 injectors with a total of 83 reservoirs. The operator measures well level production using well tests and layer level injection using injection surveys. The objective is to calculate layer level production using all available data.
In order to solve this problem, a connection network for each layer was built using the operator’s understanding of the field. Figure 4 shows such a network for a particular reservoir.
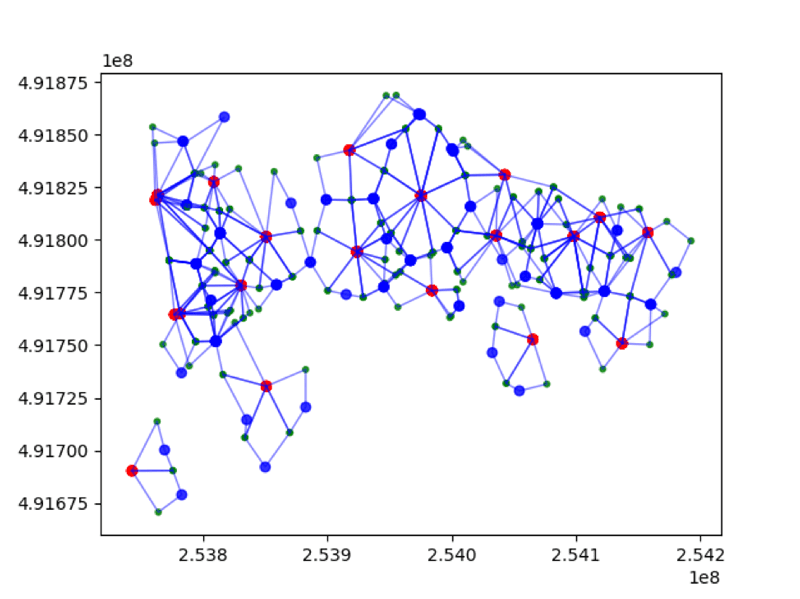
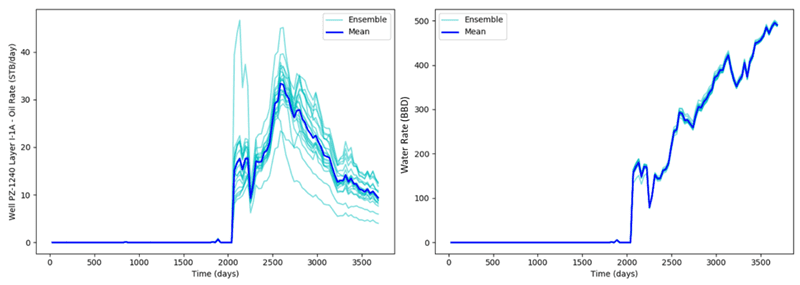
A simple two-phase, physics-based fluid flow model is then solved over these networks and combined with an ensemble estimator to fit the models to all available historical well level prediction and layer level injection data. The end result is then oil and water production rates estimated at each reservoir layer. Figure 5 shows the quality of the fit to the well level historical rates.
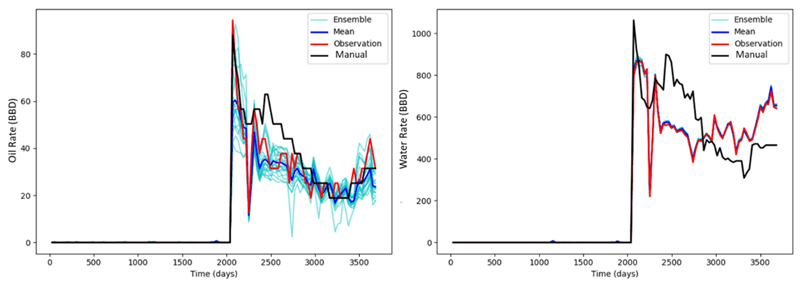
The oil rate for one of the wells is on the left and the water rate is on the right. The red curves are the measured rates, the black curve is from a traditional manual approach, the light blue curves are the ensemble estimate from the above approach, and the dark blue curve is the mean of the ensemble. It is clear that the proposed approach provides a much better match to the observed data, and even more so for water rates compared to the traditional approach. This is because the traditional manual approach is quite complex, so the engineers usually focus on matching oil only. Additionally, the traditional approach requires over three months to do a full allocation compared to less than an hour with the proposed automated approach!
Figure 6 shows the layer level allocations for one of the layers of the well obtained using the approach above. Such allocations can now be used for many engineering workflows like layer level reserves estimation.
One of the fundamental drivers of digital transformation is good quality, reliable and timely production data. By integrating different data sources with physics, machine learning and data assimilation approaches, combined with cloud and edge computing, we can lead to a step change in the quality and reliability of such critical data.
Headline photo courtesy of JT Jeeraphun/Adobe Stock
Dr. Pallav Sarma is chief scientist of Tachyus responsible for developing the fundamental modeling and optimization technologies underlying the Tachyus platform. He is a world-renowned expert in reservoir management, with multiple patents and numerous papers on the subject.
Sarma has over 12 years of experience working for Chevron and Schlumberger. As a staff research scientist for Chevron, he was responsible for its key simulation and optimization technologies. He has received many awards including the Dantzig Dissertation Award from INFORMS and Chevron’s Excellence in Reservoir Management Award.
Sarma holds a Ph.D. in petroleum engineering and a Ph.D. minor in operations research from Stanford University.


