It goes without saying benchmark West Texas Intermediate (“WTI”) crude oil prices have been on a wild ride over the past seven to eight months. After cratering nearly 80 percent from $76.90 per barrel (/bbl) on October 3, 2018 to $42.36/bbl on December 24, 2018, prices have since rebounded almost 60 percent, setting the most recent high of $66.60/bbl just four months later. This has led some to conclude that prices have likely established a peak price for the year. As such, this nominal “re-correction” has caused market participants to adjust (or re-adjust) long-term hedging strategies as a means of fending off future, sudden price declines.
Oil prices had been supported much of this year by output cuts from OPEC and other major producers, as well as by falling supplies from OPEC members Iran and Venezuela due to U.S. sanctions. Despite these reduced OPEC supplies to the global market, domestic U.S. crude supplies have swelled in recent weeks amid U.S. crude production forecast to continue rising through this year by 1.4 MMbbl/d to average 12.4 MMbbl/d, with 2020 production averaging 13.3 MMbbl/d, government data shows. In addition, the U.S. Energy Information Administration (EIA) recently cut its forecast for global oil demand to roughly 1.2 MMbbl/d this year, down from last month’s projection of about 1.4 MMbbl/d.
Overarching factors creating resistance for crude prices to inch higher include:
- Fears of a global economic slowdown due to the escalating U.S.-China trade war, which represents a risk to oil markets.
- The Trump Administration tightening its ban on Iranian oil sales to other countries, such as India and China. Consequently, this could prop up other OPEC members like Saudi Arabia, Kuwait and non-OPEC member Russia to backfill Iran’s supply gap. How much spare capacity they make up depends on the outcome of a meeting scheduled in Vienna, Austria on June 25, 2019.
- Ongoing unrest within Venezuela contributes to a highly uncertain situation that could immediately disrupt oil production there.
Where Do Crude Prices Go From Here?
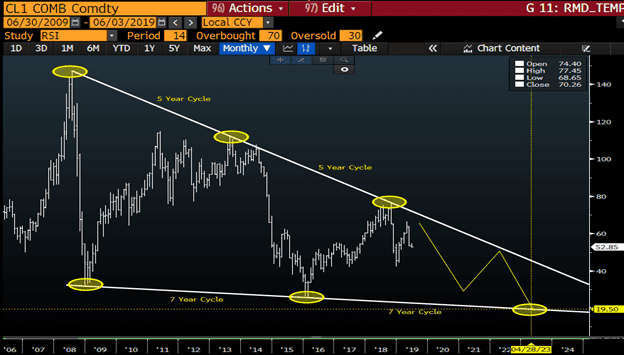
With prices sliding back toward the $50/bbl mark, I would describe myself as a short-term bull in a long-term bear market. Back in November 2018, I introduced a long-term bear scenario for WTI prices. Even with all the turbulence since then, that scenario is still intact. As you can see in the chart below, I am expecting long-term downward pressure on WTI crude oil prices, and I eventually see them settling below $20/bbl in 2023. In the short-term, I am somewhat more bullish, and I believe WTI could possibly set a new high for 2019. I think there is an outside chance we could potentially breech $70/bbl this year.

The chart above represents the historical prompt month NYMEX CL futures price. The yellow ovals highlight the relevant price highs, lows and eventual target price. (Source: Bloomberg)
What Are Hedge Prices Telling Us?
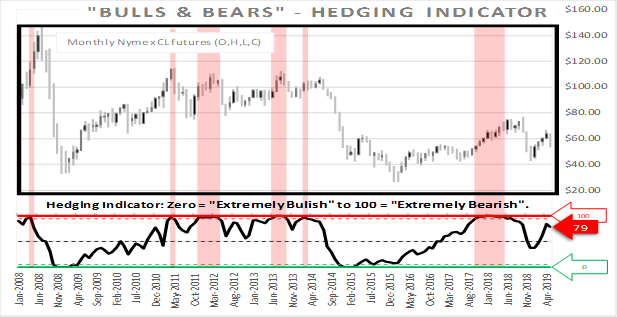
To help determine potential moves in the market, analysis of futures data has been transformed into a useful monthly pricing indicator. As of the end of May, this indicator has us firmly in bear territory. The hedging indicator is currently reading 79 out of a possible 100. After temporarily dipping into the bullish area at the beginning of the year, I would expect a continued climb into an extreme bearish reading of 95 or higher. At that point, lower prices should be imminent. This expectation would require at least several months to achieve. This timing also supports higher short-term prices.

The above indicator represents calculations based on NYMEX CL futures data. Readings above 50 are considered bearish, while readings below 50 are considered bullish. The pink shaded areas represent extreme conditions of the indicator readings 95 to 100. (Source: Opportune LLP)
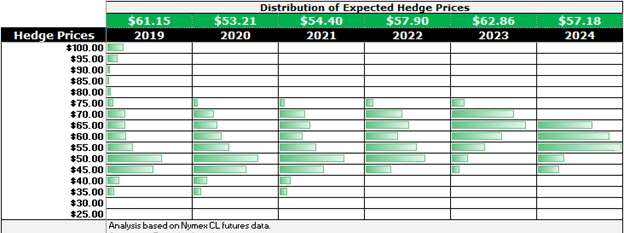
Longer-term, my analysis of the NYMEX CL futures market continues to point to compression of hedge prices. As you can see in the graph below, I have developed probable hedge prices based on market data. These prices are what we would expect a typical hedger to achieve in the market. Looking ahead to coverage over the next three years (2020-2022), expected hedge prices are estimated to be around $55/bbl. Although this is higher than most companies’ breakeven, it provides only a minimal cushion to sustain future operations. Companies without an abnormally high hedge coverage ratio could have significant difficulties operating in this environment.

The weighted average hedge prices and their associated distributions are derived from NYMEX CL futures data. These prices are what we would expect a typical hedger to achieve in the market. (Source: Opportune LLP)
This becomes even more impactful when we consider the last big price downturn of 2014. As painful as that period was for many upstream oil and gas companies, hedgers had the benefit of $90/bbl crude oil hedges. Even with that, many had a difficult time riding out that storm. Although production costs have continued to decline over the last five years, the dramatic deterioration of hedge prices could turn even the most efficient companies into casualties of the market.
Ryan is a Director at Opportune LLP. His industry experience includes commodity trading, risk management, supply chain optimization and derivative valuation. He is an expert in developing financial models to quantify complex/uncertain issues and deliver real-world solutions. He has extensive experience in the pricing, hedging and portfolio management of the retail natural gas markets. Ryan has led all aspects of commercial-deal structuring and pricing for wholesale natural gas trading and origination. He has over 15 years of experience in the energy industry. Ryan has an MBA from the University of Texas in San Antonio where he specialized in Finance.


