The natural decline rates of existing oil and gas wells across major shale plays will contribute to a tighter supply/demand balance.
The recent dramatic decline in oil prices was precipitated by an unprecedented drop in demand due to the COVID-19 pandemic played out against a backdrop of an already slightly oversupplied oil market. Oil prices have strengthened somewhat since April, but this has been primarily due to production reductions in the “OPEC +” counties (OPEC and Russia), and to a limited extent, voluntary shut-ins and curtailments in the U.S. These shut-in volumes provide a ready source of incremental production that may be returned to the market as prices improve and could lead to persistently soft prices.
The natural decline of existing wells, however, is a permanent reduction of available supply that will contribute to a tighter supply/demand balance. As U.S. operators reduce drilling activity due to unattractive economics, we wanted to examine the underlying production decline rates across the major shale plays in the U.S. to get a sense of how fast production might decline and how that decline might contribute to a better supply/demand balance and provide support to improved prices.
Oil Decline Rate
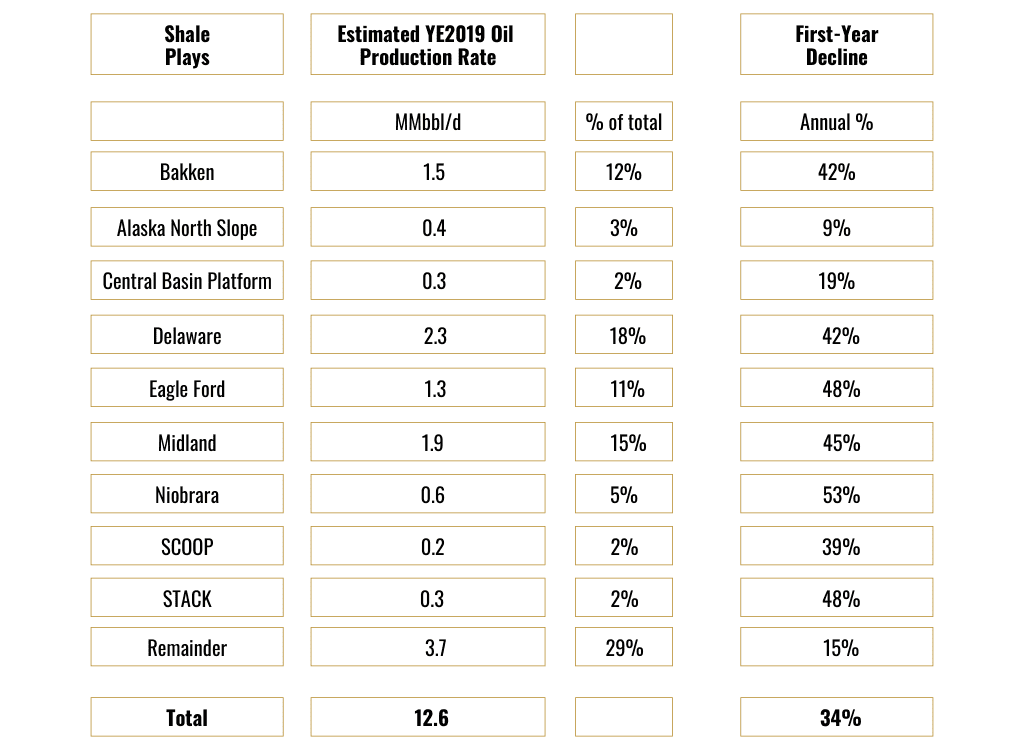
The table below shows the estimated production rate (million-barrels-per-day, or MMbbl/d) and first-year production decline of each of the major oil plays in the U.S. Production from all other wells outside of these plays are grouped in the “Remainder” category. The first-year production decline is the decline in production that we estimate would occur if all drilling stopped at the beginning of 2020.
 Here are our key takeaways from the analysis:
- Unconventional Production Dominates – Nearly two-thirds of U.S. oil production is from the unconventional plays listed above. The Remainder group and the Central Basin Platform also likely include some amounts of unconventional production, so the total is probably higher.
- First-Year Expected Declines Are High In Unconventional Plays – Even though the older wells in each play produce at lower declines than the more recent wells, their first-year decline rates for the play remain high. While it’s true that the wells decline more slowly as they age, their high initial declines mean that by the time they reach lower decline rates, they’re producing at relatively low rates that contribute little to flattening the decline of the entire play. In our analysis, the first-year declines of the unconventional plays are in the 40 to 50 percent range, while the others average around 15 percent annually.
- Total U.S. Oil Production Decline Is Significant – In our analysis, the total U.S. oil base production decline is 34 percent, which would result in a 4.2 MMbb/d reduction after one year in the absence of additional drilling.
Gas Decline Rate
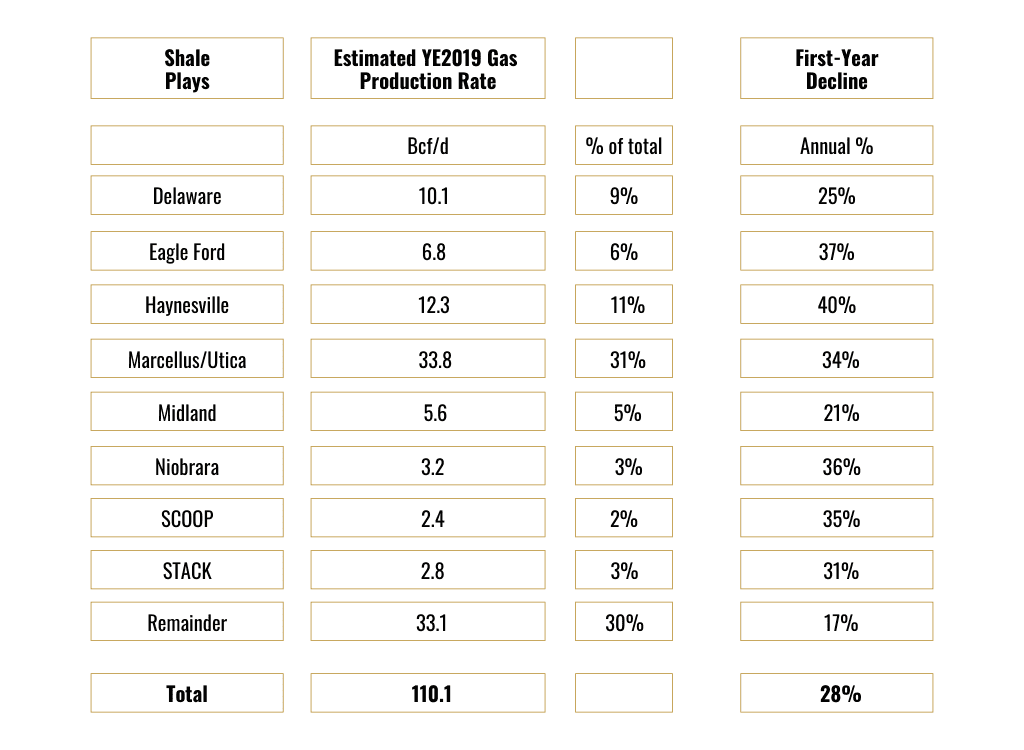
The table below shows the same analysis for U.S. gas production. In this analysis, we’ve included important dry gas plays that don’t appear in the oil analysis and excluded the Alaskan North Slope (ANS) since that gas is reinjected for pressure maintenance (contributing to their low oil production decline rate). In the table below, gas production is expressed in billion-cubic-feet-per-day (Bcf/d).
 Key takeaways from this analysis are:
- Unconventional Plays Dominate Gas Production, Too – At least 70 percent of U.S. gas production is sourced from unconventional plays. The Remainder category includes other unconventional plays, such as legacy plays like the Barnett and Fayetteville shales, that are too small to make the list above.
- The Marcellus/Utica And Haynesville Are Where The Action Is – These two plays account for over 40 percent of current U.S. production, and coincidentally, are the two areas with the most active gas-directed drilling.
- Decline Rates Are A Bit Lower For Gas – Much of this gas is associated gas in oil plays where it’s common to see rising gas/oil ratios as reservoir pressure declines. This leads to a lower gas decline rate than oil in the early life of the wells.
- Base U.S. Gas Decline Rate Is Still Significant – The estimated base decline of 28 percent implies that U.S. production would be 31 Bcf/d lower after a year if no additional drilling occurred.
Conclusions
The base U.S. production decline rates for oil and gas are significant and would result in meaningful reductions in production rates if drilling were completely halted. This is unlikely as improving oil prices will allow some drillers to remain active in the core of the best oil plays (the Midland and Delaware basins, for instance), and the economics in the core of the best gas plays remain attractive at current gas prices.
Even so, if drilling were halted, the natural decline of the existing U.S. oil wells by itself probably would not be sufficient to restore oil prices in a year’s time. Although it will play a role, the supply/demand imbalance won’t be fully improved until oil demand improves to levels closer to those before the COVID-19 pandemic.
Methodology
To conduct our analysis, we relied on monthly production data from Enervus. We accessed the entire U.S. production dataset from 2000 to 2019 and aggregated the monthly values by play and “vintage” (year drilled). We estimated the decline rate for the aggregate production of each play and vintage using decline curve analysis, and then re-assembled the vintages to derive a production outlook for each play. For the most recent vintages where the production history was short and a definitive decline curve hasn’t yet been established, we looked to other vintages in the play to estimate reasonable decline curve parameters.
Steve Hendrickson is the President of Ralph E. Davis Associates, an Opportune LLP company. Steve has over 30 years of professional leadership experience in the energy industry with a proven track record of adding value through acquisitions, development and operations. In addition, Steve possesses extensive knowledge in petroleum economics, energy finance, reserves reporting and data management, and has deep expertise in reservoir engineering, production engineering and technical evaluations. Prior to joining Opportune, Steve was Principal of Hendrickson Engineering LLC, a licensed petroleum engineering firm focused on reserves assessment and property valuation supporting property acquisitions and corporate restructurings. Steve began his career at Shell Oil as an engineer in Permian Basin waterfloods and CO2 floods. Since then, he has focused on leading upstream oil and gas reserves evaluation/engineering projects serving in management or as an executive at several E&P companies, including El Paso Production Company, Montierra Minerals & Production LP and Eagle Rock Energy Partners LP. Steve is a licensed professional engineer in the state of Texas and holds an M.S. in Finance from the University of Houston and a B.S. in Chemical Engineering from The University of Texas at Austin. He currently serves as a board member of the Society of Petroleum Evaluation Engineers (SPEE).


