
A parked wind turbine looks safe during a storm, but wind hitting its blades backward creates violent forces today’s safety models still cannot fully predict
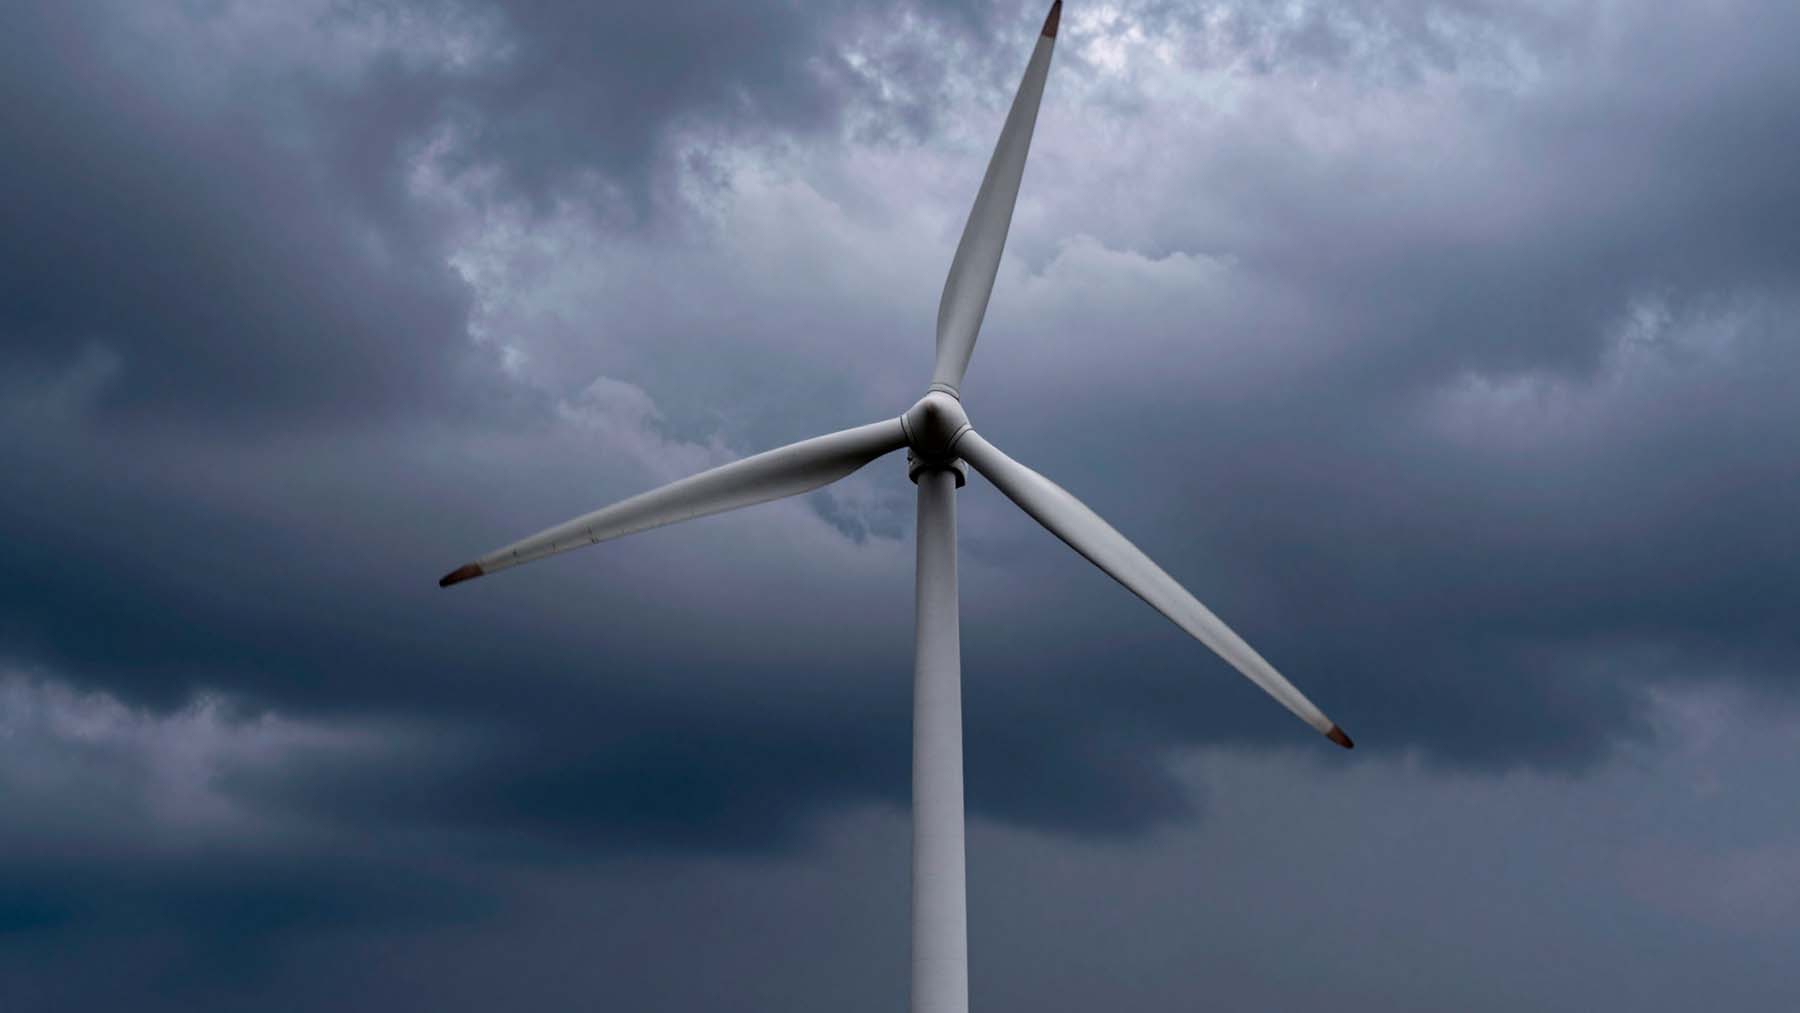
A parked wind turbine looks like the safest version of itself — blades locked, rotor still, waiting out the storm. But aerodynamically, standstill may be one of the most punishing states a turbine can endure. When strong winds strike a stationary blade from the wrong direction, the airfoil enters a regime engineers call reverse flow. Vortices form erratically, forces oscillate in wide irregular loops, and the aerodynamic behavior becomes deeply asymmetric in ways that standard design models were never built to handle.
When ‘doing nothing’ is the most dangerous state
Standstill doesn’t mean safe. When a turbine is parked or idling — blades locked during extreme winds or caught at a steep yaw misalignment — the rotor stops spinning but the aerodynamic forces keep arriving. Wind can strike the blade at almost any angle, including directly from behind, pushing flow from trailing edge to leading edge rather than the other way around.
Modern blades make this worse. For turbines rated above 15 MW, field data suggest that blades can become aerodynamically unstable in reverse flow at wind speeds as low as 8 m/s — well below what most people would consider dangerous. The blades are simply so large that even modest winds hitting from the wrong direction can trigger oscillatory loading, accumulating fatigue damage over time.
Øye and BL, by contrast, massively underestimated hysteresis width — producing smooth, quasi-steady predictions where the physics demanded wide, irregular loops.
Researchers categorize this instability through a framework called stall-induced vibration, or SIV, with four distinct regimes depending on flow direction and angle of attack. SIV-1 covers normal flow — air approaching from the leading edge, as designed. SIV-2 covers reverse flow, where everything runs backward relative to the airfoil’s intended orientation. Industry standards already require engineers to account for this: Design Load Case 6.2, defined by IEC and DNV standards, mandates modeling the full 360-degree angle-of-attack range. Whether the tools used to model it are actually up to the task is a different question.
Normal stall vs. reverse flow: two very different aerodynamic worlds
Dynamic stall is already complex under normal conditions. When a blade pitches rapidly, flow separation and reattachment don’t happen instantly — a leading-edge vortex forms, travels across the surface, and sheds, creating hysteresis where lift and drag forces trace wide loops rather than simple curves. In SIV-1, this process is reasonably well understood, and engineering models have been calibrated against decades of wind tunnel data.
SIV-2 is a different world entirely. When flow enters from the trailing edge, pressure gradients reverse, separation bubbles form in unfamiliar locations, and vortex shedding follows patterns with no equivalent in normal-flow dynamics. The physics aren’t just more extreme — they’re structurally different. Most wind turbine blades use cambered profiles optimized for normal flow, and in reverse flow that camber creates pronounced asymmetries between positive and negative angle-of-attack ranges. The same blade behaves differently depending on which side the reversed flow strikes, and that asymmetry is a core reason standard models struggle.
How the study was designed — and what the simulations revealed
To probe these dynamics systematically, researchers used the S814 airfoil — a 24%-thick profile with extensive experimental data available from Ohio State University. The Reynolds number was set at approximately 1×10⁶. The airfoil was subjected to sinusoidal pitching motion across all four SIV zones, with the same reduced frequency and amplitude applied throughout to allow direct comparisons.
Two parallel approaches were used. High-fidelity CFD simulations ran in OpenFOAM using an unsteady Reynolds-averaged Navier–Stokes (URANS) solver with a k-ω SST turbulence model. At the same time, three semi-empirical models — Øye, Beddoes–Leishman (BL), and IAG — ran in BLADED software. In SIV-1, the CFD captured hysteresis loops matching experimental data reasonably well. In SIV-2, it revealed pronounced hysteresis loops, early flow separation, and irregular vortex shedding that none of the semi-empirical models could reproduce. The two directions of reverse flow effectively behave like two distinct aerodynamic problems.
Where the IAG model succeeds — and where all models still fall short
Using L2-norm calculations across all four SIV zones, the IAG model consistently outperformed both Øye and BL. In SIV-1, IAG’s error was roughly half that of its competitors, accurately capturing hysteresis magnitude and stall onset when fed high-quality experimental polar data. Øye and BL, by contrast, massively underestimated hysteresis width — producing smooth, quasi-steady predictions where the physics demanded wide, irregular loops.
In SIV-2, the picture darkened for everyone. Øye and BL failed to reproduce hysteresis loops at all. IAG came closest but still underestimated peak unsteady load amplitudes. One targeted adjustment helped: setting the critical stall normal force to zero — treating the airfoil as continuously stalled across the SIV-2 range — improved IAG’s predictions noticeably. Strong load amplitudes remained underrepresented even so. That residual error points to something deeper than a tuning problem; the fundamental modeling architecture simply wasn’t designed for this regime.
What this means for the next generation of turbine design
The study identified reduced frequency — not Reynolds number — as the dominant driver of hysteresis loop shape in SIV-2. Higher reduced frequency produces fuller, stronger loops, while doubling the Reynolds number had comparatively little effect. This matters for how future models should be structured: capturing unsteady motion effects takes priority over refining viscous corrections.
Input data quality also emerged as critical. Experimental polar data produces the best results, followed by 3D large-eddy simulation or detached-eddy simulation data, then 2D CFD. At the bottom sits extrapolated data — the least reliable option and, problematically, the most common industry approach for the SIV-2 range. As turbines grow beyond 15 MW, closing the modeling gap in SIV-2 becomes a structural safety question, and the tools to answer it don’t fully exist yet.
You can check the complete study here: Bangga G, Syawitri TP and Chairunnisa (2026) Dynamic stall modeling of a wind turbine airfoil at various stall-induced vibration zones. Front. Energy Res. 14:1761590. doi: 10.3389/fenrg.2026.1761590

Carlos is an engineer with strong expertise in technical and industrial topics. He previously worked at international companies such as Siemens and is multilingual.
