
U.S. utility-scale solar, wind, and battery storage hit new capacity records in Q2 2026, S&P Global finds
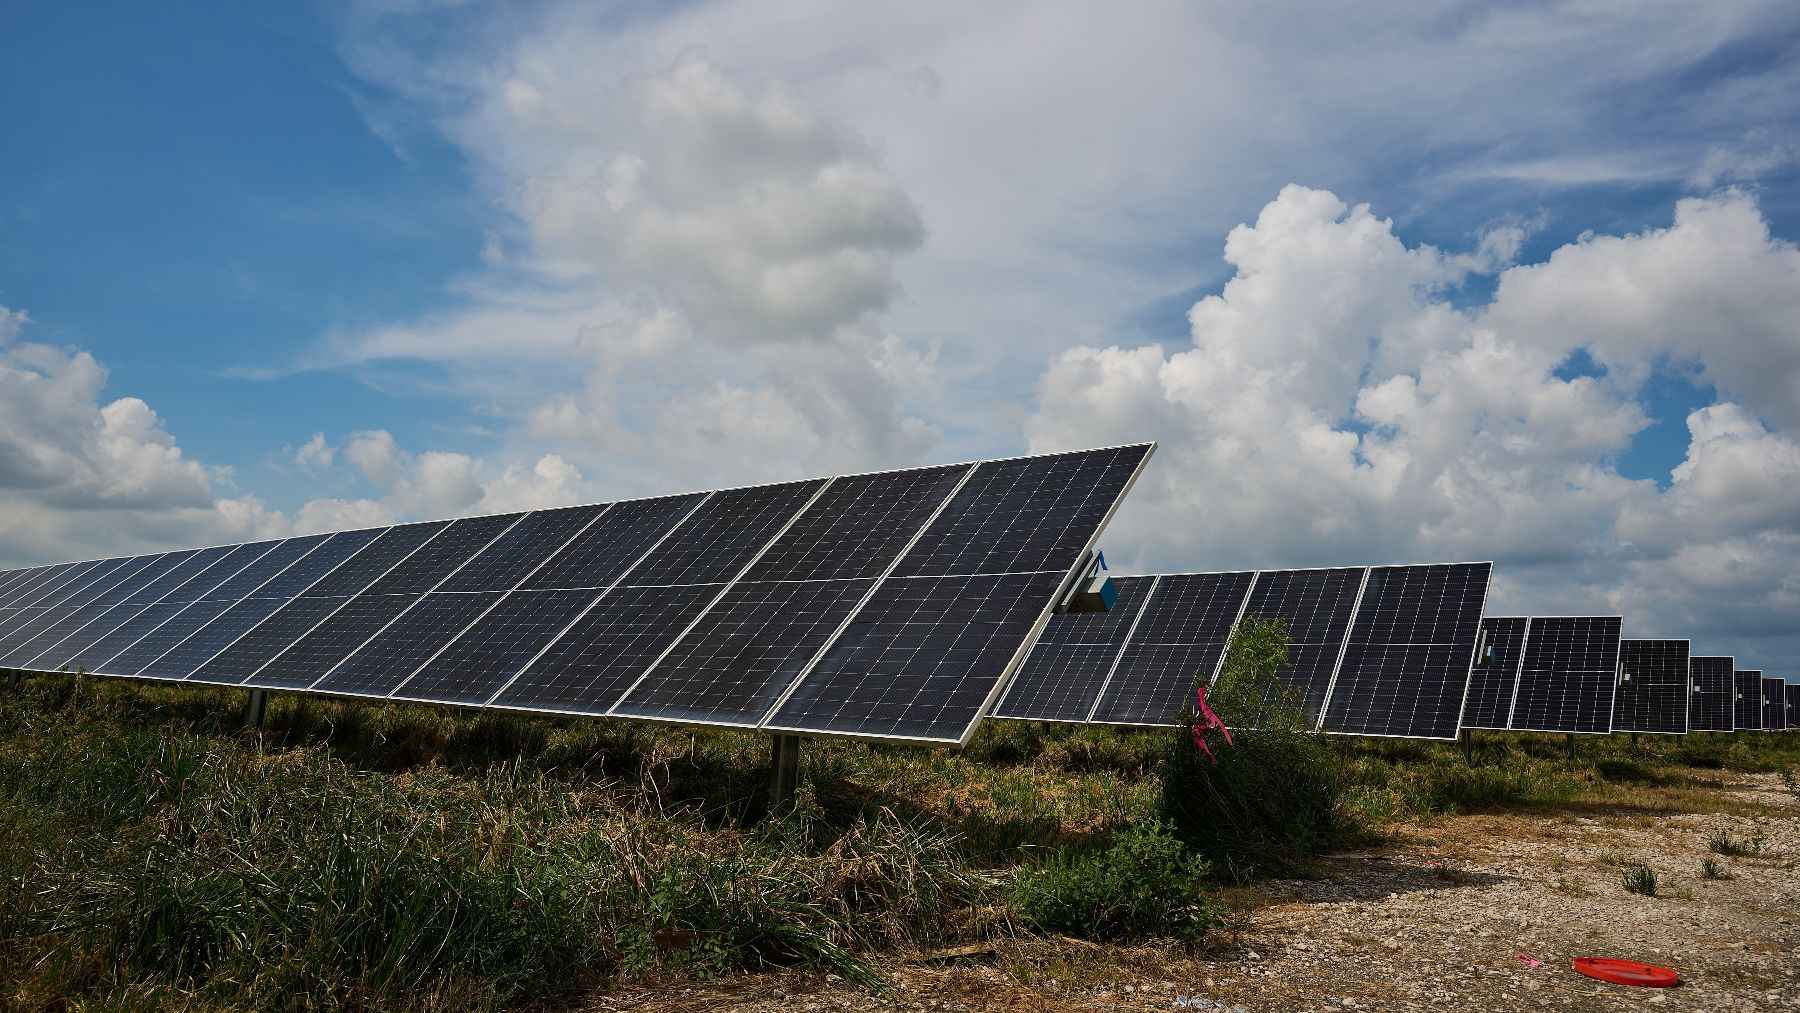
The U.S. clean energy buildout hit a notable milestone in the second quarter of 2026. According to new analysis from S&P Global Market Intelligence, developers added nearly 7.5 GW of utility-scale solar — a 21% jump year-over-year — while battery storage set a quarterly record at 5.6 GW and wind posted its strongest quarter since 2021 with 5.1 GW of new capacity.
All three sectors hit significant milestones in the same quarter. That’s not a coincidence — it points to something broader shifting in U.S. energy infrastructure.
Q2 2026 capacity additions by the numbers
The headline figures from S&P Global Market Intelligence are striking on their own. They carry even more weight when you look at them side by side.
Cost trends helped too — solar panel prices and battery system costs have declined over time, making large-scale projects more financially viable at a faster pace.
Solar led the way with nearly 7.5 GW of utility-scale capacity added during Q2 2026 — a 21% increase compared to the same quarter a year earlier. That’s a meaningful jump for a sector that was already growing steadily.
Battery storage grabbed attention in a different way. The 5.6 GW added during the quarter set an all-time quarterly record for the technology in the U.S., reflecting how quickly storage has moved from a niche grid tool to a mainstream infrastructure component.
Wind rounded out the picture. At 5.1 GW, Q2 2026 marked the technology’s strongest quarterly performance since 2021 — a real rebound for a sector that had faced supply chain disruptions and siting challenges in recent years. What makes this quarter stand out isn’t any single number — it’s that all three sectors hit significant milestones simultaneously, according to S&P Global’s data.
Drivers behind the surge in renewable and storage deployment
Several forces converged to produce these results. None of them is entirely new, but their combined effect appears to have pushed deployment into a higher gear.
Investment momentum in utility-scale clean energy has stayed strong. Grid operators and corporate buyers have kept seeking reliable renewable capacity, and developers have responded by accelerating project timelines to meet that demand. Cost trends helped too — solar panel prices and battery system costs have declined over time, making large-scale projects more financially viable at a faster pace. Lower costs mean more projects can clear the financial hurdles required to reach construction.
Federal tax credits have also played a meaningful role in pushing projects forward. Incentives tied to clean energy development motivated developers to move quickly, especially given uncertainty about whether those credits will stick around long-term. When expiration looms, activity tends to concentrate in the near term — developers race to qualify projects under current rules before anything changes.
What the record additions mean for the U.S. grid
These aren’t just impressive stats. They have real implications for how the U.S. power grid actually operates.
Battery storage is the most consequential piece of the Q2 story from a grid reliability standpoint. Variable renewable sources like solar and wind produce power when the sun shines and the wind blows — not necessarily when demand peaks. Storage helps bridge that gap by capturing excess generation and dispatching it when it’s needed most. The combination of record solar and record storage additions in the same quarter suggests the industry is increasingly building the two together, producing something closer to dispatchable clean energy rather than purely intermittent generation.
Wind’s strong quarter adds a different dimension. Wind resources are geographically distributed differently than solar — stronger in the Great Plains and parts of the Midwest, for example — so more wind capacity means more regional diversification in the renewable mix, which can strengthen grid resilience. Taken together, these additions suggest the U.S. energy transition may actually be picking up speed.
Development pipeline and industry headwinds through 2031
If Q2 2026 shows where the industry is now, the development pipeline offers a glimpse of where it’s headed.
S&P Global’s analysis identified nearly 300 GW of solar and more than 212 GW of storage targeted for completion between 2026 and 2031. Those are large numbers, and they suggest developers are planning for continued aggressive buildout over the next several years.
The pipeline doesn’t guarantee delivery, though. Trade tariffs on imported components — including solar panels and battery materials — continue to pressure project costs. When input costs rise, projects that looked financially viable on paper become harder to finance and build. Expiring federal tax credits create a separate layer of uncertainty, complicating long-term financing and sometimes delaying final investment decisions altogether.
Permitting constraints remain a structural bottleneck that hasn’t meaningfully improved despite the scale of the buildout. Even projects with financing in place can face years of delays navigating federal, state, and local approval processes — a problem that shows no signs of resolving quickly.
What to take away from Q2 2026’s clean energy milestone
Q2 2026 was a standout quarter for U.S. clean energy deployment. Solar hit a new year-over-year growth benchmark, battery storage set an all-time quarterly record, and wind posted its best performance in five years — all at once, according to S&P Global Market Intelligence.
Sustained investment, declining costs, and policy incentives motivating near-term action all contributed. The grid implications are real, particularly as storage and solar grow together into a more dispatchable pairing. And while the development pipeline through 2031 points to continued ambition, tariffs, tax credit uncertainty, and permitting bottlenecks remain genuine constraints on how much of that pipeline actually gets built.

Kelly is an experienced writer with 15 years of experience exploring the big stories that shape our world, from tech breakthroughs and space exploration to climate, energy, and the fascinating quirks of science. She has a talent for turning complex ideas into sharp, memorable insights that stay with readers long after they’ve finished reading.
