
Researchers found that public wind maps used to site thousands of turbines across America carry hidden errors that a new machine-learning tool can now quietly correct
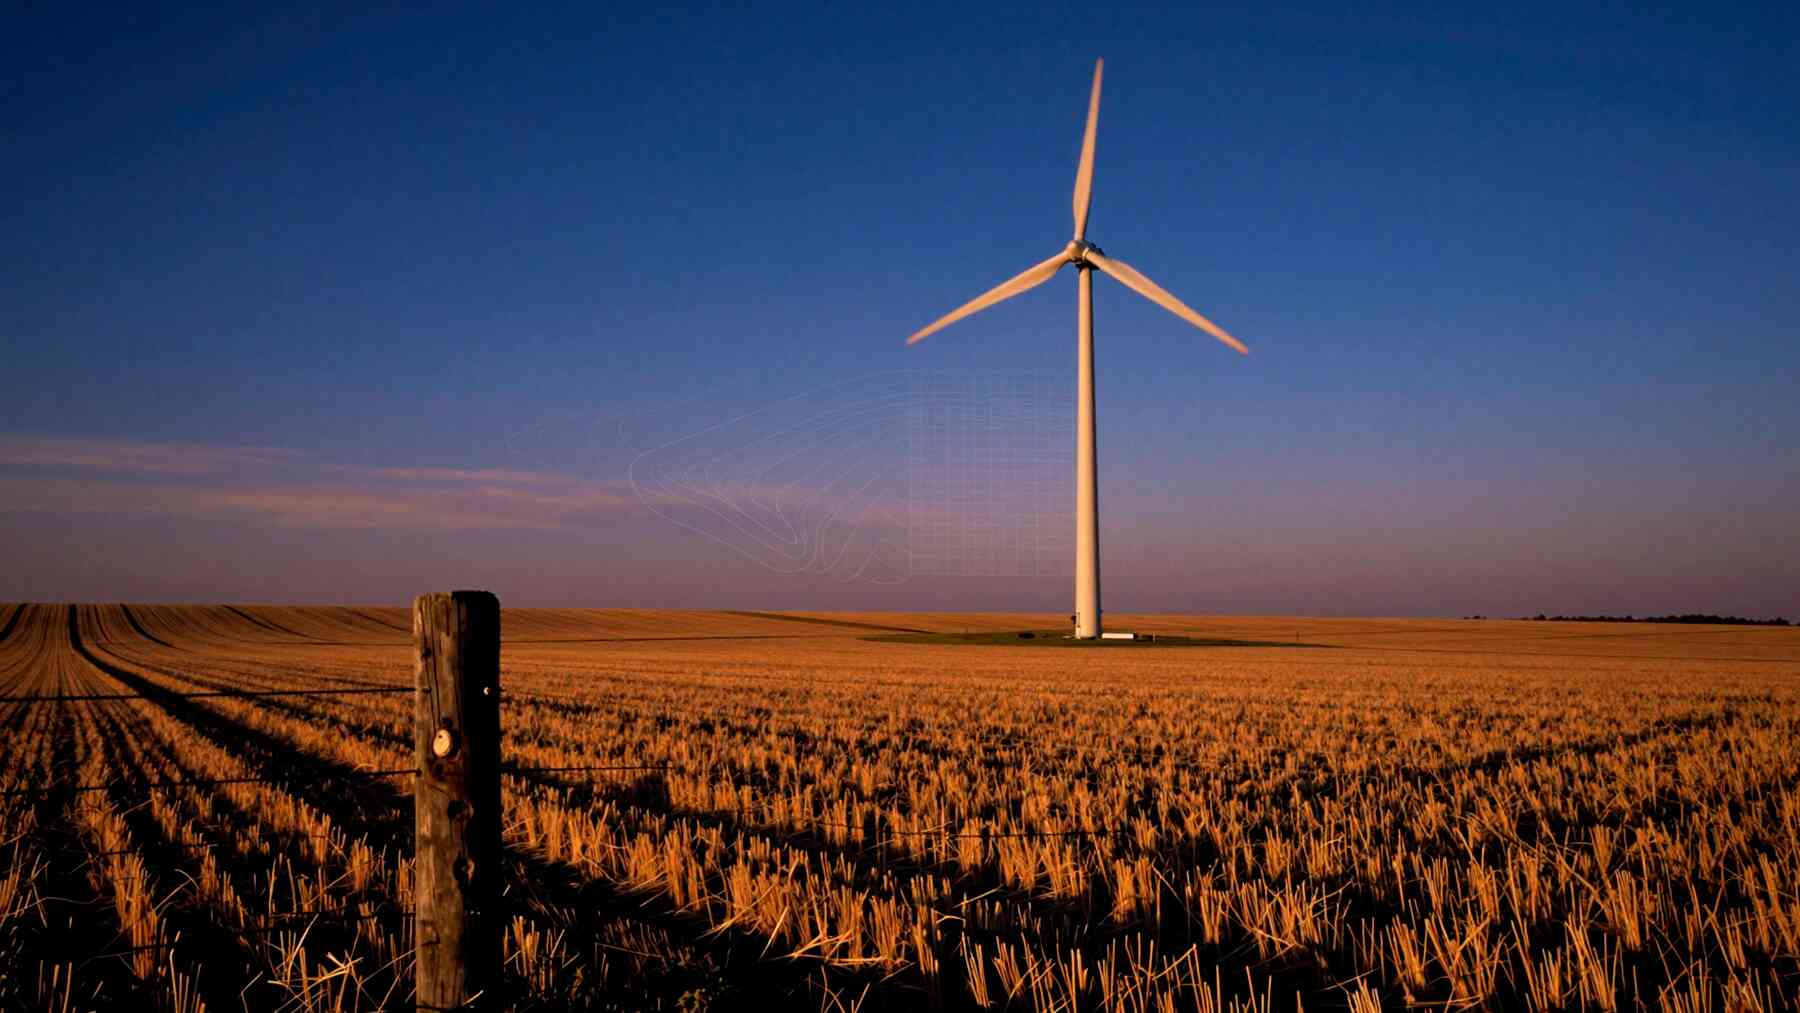 AI-made
Thousands of American farms, rural cooperatives, and small energy developers rely on public wind maps to decide where to plant a turbine. Most do not have the time or budget for expensive, on-site measurements.
Because of this, these free datasets have become the default foundation for distributed wind planning.
But new evidence suggests this foundation has cracks.
Researchers also think this exact machine-learning approach could work for other renewables, like solar power, where public data exists but varies wildly in quality.
The accuracy of these trusted maps at specific sites is still a mystery. Invisible errors could be quietly throwing off big investment decisions across entire regions.
The data problem hiding in plain sight
Public wind resource datasets are the default starting point for a reason. Testing a site’s wind with physical sensors is a massive hassle. A dedicated measurement campaign takes months and costs way more than a small project can handle.
For rural communities, free public maps are the only option.
Yet, almost everyone has overlooked a massive gap. Nobody had systematically checked how accurate these maps really are at the “hub height” where turbines actually spin.
To make things worse, different datasets cover different time periods, making direct comparisons almost impossible.
So, a critical question went unanswered: how wrong are these tools? That missing answer has quietly warped early-stage wind projects across the country.
Building a benchmark from real-world observations
To solve this, researchers built a brand-new benchmark. It evaluates the most popular wind models side-by-side on a level playing field.
The big challenge was simple math. You cannot easily compare two datasets if they cover different years.
The team solved this with a clever statistical trick: they used long-term, empirical wind speed “quantiles.” This captures the full shape of a site’s wind behavior, not just a simple average.
This approach does two very important things. First, it shows how well a dataset mirrors the real-world spread of wind speeds at a specific spot. Second, it exposes localized biases.
These are two completely different kinds of errors that can steer a project in the wrong direction. According to the research team, this is the first systematic effort to hold these public datasets to a strict, observational standard.
How machine learning closes the accuracy gap
Instead of building a new wind model from scratch, the researchers trained a machine-learning model to combine several existing ones.
The logic is beautifully simple. Every map has its own strengths and blind spots. By teaching an algorithm to weigh and blend them, the team built an ensemble model that highlights strengths and cancels out mistakes.
The payoff is huge. The localized bias dropped down to nearly zero across the entire range of wind speeds. The average error in long-term wind speeds fell by about one-third compared to the single best model we had before.
That is a massive leap in accuracy, achieved without setting up a single new physical sensor.
A national wind map, redrawn
The researchers did not just leave their method in a laboratory. They used their trained model to map the entire United States, generating a massive grid of wind speed data.
This new data is now completely free and public. It lives on WindWatts, a platform built by the U.S. Department of Energy specifically to help local communities plan wind projects.
This real-world deployment is a game-changer.
Planners and local developers can access highly reliable wind data instantly without spending thousands on physical sensors. The research bypassed academic journals and went straight to a tool that practitioners use right now.
What this means for distributed wind’s future
Siting a wind turbine at a school, a local farm, or a rural warehouse is a high-stakes decision. These smaller projects are incredibly sensitive to early data.
A marginal site might get rejected if a map underestimates the wind. A terrible site might look like a goldmine on a buggy map. Better data protects communities from both costly traps.
Even better, this benchmark framework can keep growing. As we get better data, we can plug it right back into the model.
Researchers also think this exact machine-learning approach could work for other renewables, like solar power, where public data exists but varies wildly in quality.
Right now, the big story is how local planners will use this upgraded WindWatts data. If this tool works as promised, it could quietly transform which local wind projects get built across America.
But to truly fix our clean energy planning, we have to look closer at the original maps. What are those hidden errors, and what do they mean?

Kelly is an experienced writer with 15 years of experience exploring the big stories that shape our world, from tech breakthroughs and space exploration to climate, energy, and the fascinating quirks of science. She has a talent for turning complex ideas into sharp, memorable insights that stay with readers long after they’ve finished reading.
